October 19, 2026 · 14 min read · Pineflows team
Backtested Trading Strategies: From Theory to Live Execution
Learn how to validate backtested trading strategies, avoid overfitting and look-ahead bias, and operationalize a vetted strategy
You've got a TradingView strategy with an equity curve that looks steady, entries that seem sensible, and a report that makes the setup feel ready. Then you turn on alerts and the live results don't match. A trade arrives late, another doesn't fill where the backtest assumed, and now the P&L is moving away from the curve you trusted.
That gap doesn't tell you, by itself, whether the strategy failed, execution deviated, or your measurement was incomplete. Backtested trading strategies need more than plausible settings. They need a validation process and an audit trail that can explain what happened after a signal.
Table of Contents
- When a Beautiful Backtest Disappoints Live
- What Backtesting Actually Measures
- The Three Biases That Poison Backtests
- Reading Performance Metrics Without Fooling Yourself
- Validating a Backtest With Out-of-Sample and Walk-Forward Tests
- Two Backtested Strategies Compared End to End
- Operationalizing a Vetted Strategy With Test-First Automation
- A Practical Pre-Live Checklist for Any Backtested Strategy
When a Beautiful Backtest Disappoints Live
A familiar failure starts with a strategy that looks clean in TradingView's Strategy Tester. The rules are understandable, the historical curve rises smoothly, and the trader connects alerts to Robinhood. Live trading begins, but results drift. One alert appears to arrive after the intended move, another seems to have triggered twice, and a market order fills at a price the historical simulation never showed.
The tempting response is to change the strategy immediately. Maybe the entry condition needs another filter. Maybe the stop is too tight. But changing rules before diagnosing the gap can make the evidence harder to interpret. A disappointing live result could reflect a weak strategy, a missed or duplicated alert, a delay between signal and submission, a different fill, or a backtest assumption that never matched execution.
Separate the signal from the route
A backtest describes what the strategy would have done under the simulator's rules. Live execution adds a chain of events: TradingView generates an alert, a webhook receives it, the order is submitted, the broker processes it, and a fill may or may not occur as expected. If the workflow records only final P&L, those stages blur together.
That's why the useful question isn't, “Did the strategy work?” It's, “At what point did live behavior diverge from the tested behavior?” Without timestamps, alert identifiers, broker statuses, and fill details, a trader is left guessing.
Practical rule: Don't revise a strategy until you can distinguish a signal failure from an execution or measurement failure.
A disciplined process keeps strategy validation and execution observability connected. First test whether the rules generalize beyond the data used to create them. Then run the same frozen rules in a controlled forward test. Finally, compare each live event with the expected signal and simulated order.
A backtest can still be useful when live results differ. It gives you a reference point, but only if its assumptions are clear and the live path leaves enough evidence to explain the difference.
What Backtesting Actually Measures
Backtesting applies a defined set of trading rules to historical market data. It estimates how those rules would have behaved under the simulator's data and execution assumptions. It does not prove that the strategy will behave the same way in future markets or through a live broker.
Think of a backtest as a wind-tunnel test for an aircraft design. It can reveal flaws under controlled conditions, but it can't reproduce every feature of an actual flight. A TradingView Strategy Tester report is evidence about a simulation, not a promise about future returns.
Three stages, three different questions
A useful lifecycle separates historical testing, forward testing, and live execution. Each stage answers a different question, and none can substitute for the others.
| Stage | Data Used | Cost Realism | Proves |
|---|---|---|---|
| Backtest | Historical market data | Depends on configured assumptions | How the rules performed in the simulator |
| Forward test | New or live market data, often in a simulator | Can reflect current signals, but not necessarily real fills | Whether the frozen rules behave as expected in current conditions |
| Live execution | Live signals and broker activity | Actual order and fill conditions | What the deployed workflow did in practice |
Forward testing avoids some kinds of future-data leakage because the strategy encounters data as it arrives. But it offers less information than a long historical record, so it's a controlled checkpoint rather than a shortcut to certainty. Paper trading can help verify that alerts and decisions occur as expected without submitting real orders. Live execution adds actual order handling and fills.
A sensible sequence is backtest, validate, forward-test, then automate. Each stage should preserve the same strategy logic. If the code or parameters change, record the change and treat the updated version as a new candidate rather than comparing unlike tests.
The value of a backtest comes from its construction and from what follows it. A report without clear rules, documented assumptions, and independent validation can look precise while answering a narrow question. Use it to find obvious problems and form a testable hypothesis, then demand more evidence before relying on it.
The Three Biases That Poison Backtests
A strategy can be coded correctly and still produce misleading results. The common thread is that the test gives the strategy an advantage it wouldn't have had in real time, or selects a winner because it fit the historical sample unusually well.
Overfitting is a search problem
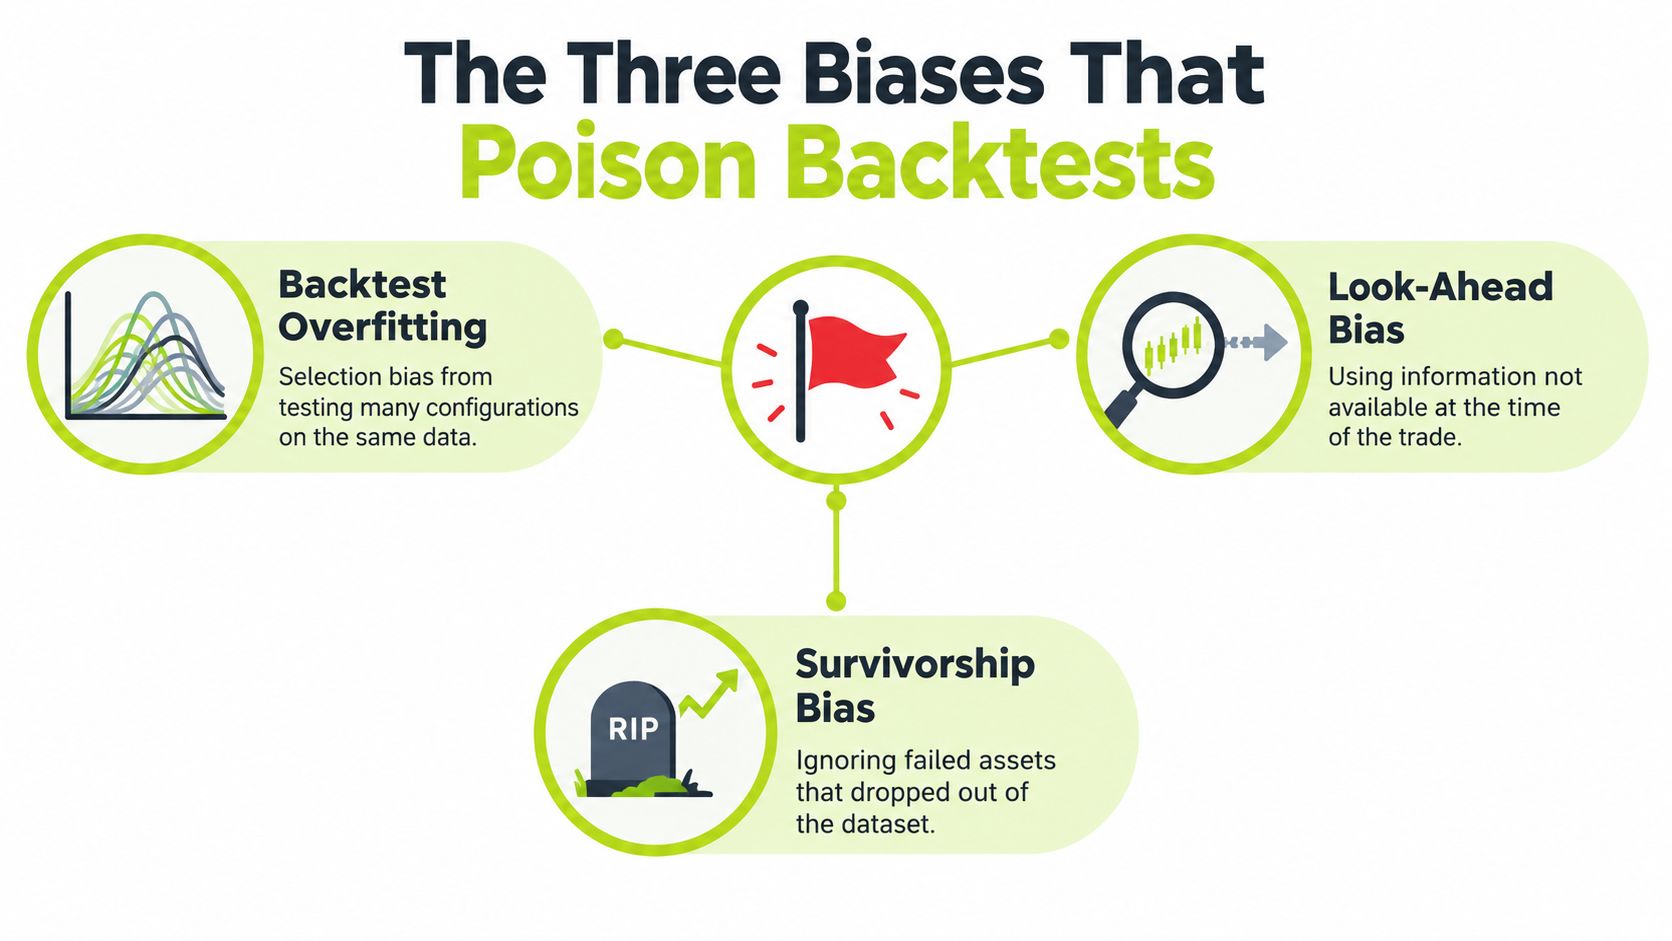
Backtest overfitting occurs when researchers test many strategy variations on the same historical data and choose the result that looks best. Bailey, Borwein, López de Prado, and Zhu formalized the Probability of Backtest Overfitting (PBO) in a 2017 Journal of Computational Finance article. Their combinatorially symmetric cross-validation method repeatedly divides data into in-sample and out-of-sample portions, selects the strongest in-sample strategy, and checks how often it performs worse than the median candidate out of sample (the authors' PBO paper).
For Pine Script, every change to entry rules, exits, indicators, timeframes, and sizing can add to the implicit search. A final script with only a few rules may still be the winner of a much larger experiment. A high in-sample Sharpe ratio alone can't show whether the selected rules captured a durable pattern or historical noise.
Leakage and survivor filtering distort the test
Look-ahead bias appears when a strategy uses information that wasn't available at the time of the signal. For example, a rule that depends on a completed daily close can't act on that confirmed close before the daily bar has ended. If a historical test effectively uses the final value earlier, its simulated decisions have information a live trader wouldn't possess.
Survivorship bias changes the test universe by excluding assets that failed or disappeared. A stock screen based only on symbols that trade today can omit companies that were delisted. The remaining universe may make the strategy look stronger than it would have across the original set of eligible assets.
A 2016 study by Bailey, Borwein, López de Prado, Salehipour, and Zhu describes how repeated experimentation can produce impressive historical results, and introduces simulation tools for seasonal and econometric strategies. The authors report that econometric methods can produce extreme overfitting, raising questions about strategies published in academic journals (the study on backtest overfitting). Publication, a long simulated record, or a striking Sharpe ratio doesn't independently establish predictive power.
Frictions belong in the model
Commissions, spread, slippage, order type, liquidity, and intrabar price paths all affect execution. A strategy whose edge depends on frequent, tightly priced fills is especially vulnerable when those assumptions differ from live conditions. A backtest can be technically sound and still be strategically uninformative if it omits material frictions or hides the number of variants tested.
Reading Performance Metrics Without Fooling Yourself
A performance report is a collection of clues, not a verdict. Each metric describes a different feature of the simulated trades, and each can mislead when read alone.
Sharpe ratio compares return with variability. A higher value may look attractive, but an in-sample Sharpe can be inflated by trying many configurations and reporting only the winner. Maximum drawdown describes the deepest peak-to-trough decline in the tested equity curve. It helps show the historical pain the strategy experienced, but it doesn't establish how severe a future drawdown could be.
Win rate is the share of trades that closed profitably. It says little without the size of winners and losers: a strategy can win frequently and still lose overall if its losses outweigh its gains. Profit factor compares gross profits with gross losses. It's useful as a summary, but the same aggregate can conceal different sequences of wins and losses, as well as different exposure to market risk.
Look beyond the winning configuration
Exposure-adjusted return adds another useful perspective by considering how much time or capital the strategy had at risk. A strategy that earns a similar return while staying exposed less may behave differently from one that is nearly always in the market. The relevant comparison depends on the strategy's intended use and risk constraints.
For deeper evaluation, quant trading software should make it possible to inspect not only summary metrics but also trades, configurations, and test partitions. The question is not whether one chosen backtest looks impressive. It's whether the performance remains credible across independent evaluations.
Bailey and coauthors' CSCV framework evaluates candidates over many train/test partitions and measures how often the in-sample winner falls below the median out of sample. For a practical workflow, record the distribution of out-of-sample ranks, not just the winning strategy's in-sample Sharpe. A candidate that repeatedly ranks near the middle or lower end outside the development data deserves skepticism, even if its selected historical curve looks exceptional.
A reliable result is usually less dramatic than a single best-case report. Look for behavior that remains reasonably consistent across partitions, rather than a strategy that shines only in the period or configuration used to select it. The spread of results matters because the test is meant to assess stability, not reward a lucky fit.
Validating a Backtest With Out-of-Sample and Walk-Forward Tests
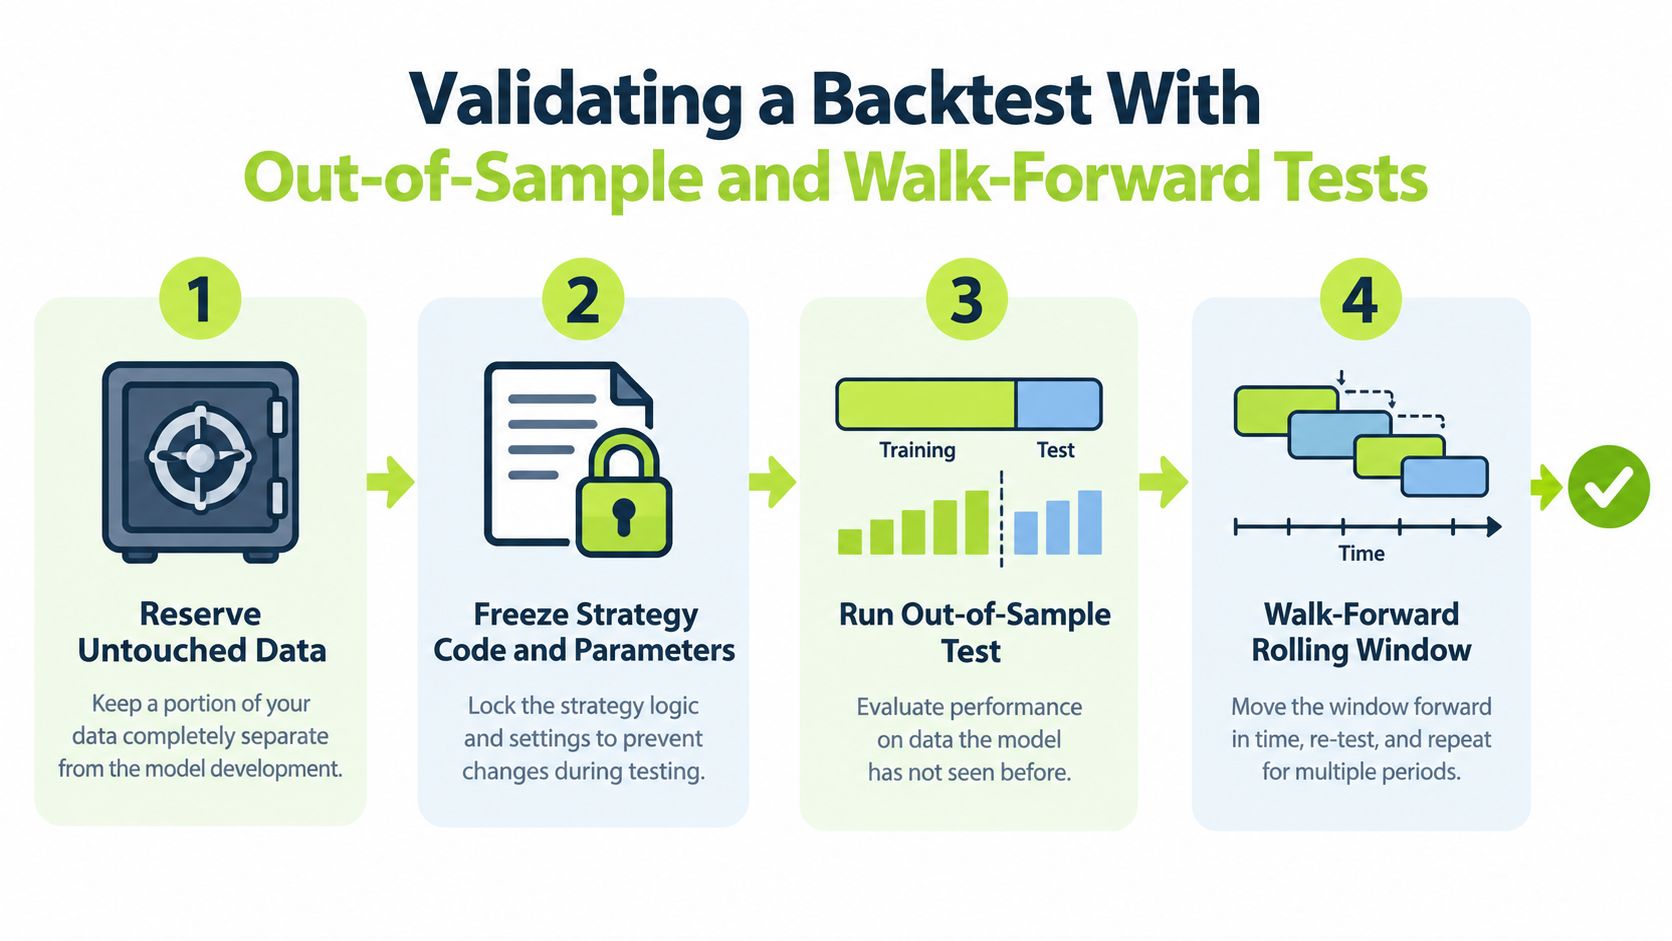
Validation only works when the strategy can't adapt itself to the confirmation data. If you inspect a test period, alter the rules in response, and report the revised result on that same period, it has become part of development rather than independent confirmation.
Lock the candidate before testing
Start by keeping a record of the alternatives you try. Include rule changes, parameter choices, indicators, timeframes, and sizing variations. The number of candidates matters because selecting the best result after a broad search makes it more likely that the winner benefited from noise. The 2017 PBO framework is designed to quantify this kind of selection risk; it doesn't make a contaminated holdout independent again.
Next, reserve data that wasn't used to make development decisions. Freeze the Pine Script code and parameters before you evaluate that data. If the result disappoints, don't tune against the holdout and still call it a clean confirmation. Make a new version, document the change, and find fresh evidence for the new candidate.
There's no universal minimum number of trials that makes a PBO estimate meaningful in every setting. The key is to make the search process visible and use enough candidate variation and partitions for the comparison to reflect the actual research process, rather than implying precision from an arbitrary cutoff.
Use walk-forward testing to assess drift
Walk-forward analysis repeatedly applies a development period followed by a later test period. It can help assess how a strategy behaves as market data advances, but it isn't the same as running one frozen parameter set forever. If parameters are re-optimized at each window, record the optimization procedure and judge that procedure as the strategy. If parameters stay frozen, the test instead evaluates that fixed rule set across changing periods.
Include realistic costs and order assumptions from the start. TradingView notes that slippage is dynamic and can't be simulated precisely, so a configured value is a model assumption, not a guarantee of live fills (TradingView's strategy documentation). Test plausible costs and order types, and document what the simulator can't represent.
Once the code is locked, paper trading can check alert behavior against incoming market data without committing to live orders. A TradingView paper-trading workflow can help make that stage explicit. The point is to move forward with a known candidate and a record of what each stage tested, not to keep repairing the same result until it passes.
Two Backtested Strategies Compared End to End
Consider two hypothetical Pine Script candidates. The first uses several indicators, different entry filters, multiple timeframes, and tuned exit settings. Its selected in-sample report looks striking, but the strategy was chosen from many variations tested on the same history. When evaluated on untouched data, its results weaken and its rank varies sharply across partitions.
The second candidate uses fewer rules and produces a less dramatic historical curve. Its results are more consistent across walk-forward windows, though no window guarantees future performance. The contrast doesn't prove that simple strategies always win. It shows why the evaluation process matters more than the most flattering report.
Compare the assumptions, not just the headline
| Test dimension | Tuned candidate | Simpler candidate |
|---|---|---|
| Rule history | Many configurations were explored | Fewer documented choices |
| In-sample appearance | Strong selected result | More modest result |
| Confirmation behavior | Weakens outside development data | More consistent across test windows |
| Cost sensitivity | Sensitive to changes in fill assumptions | Easier to inspect under the same assumptions |
| Auditability | Harder to reconstruct the path to selection | Easier to trace code and parameter choices |
The table describes a qualitative comparison, not measured returns. No invented performance figures are needed to see the key issue: a candidate's apparent strength must be judged in light of how it was selected and whether its behavior persists beyond the selection data.
Run both candidates under the same cost assumptions. Add commissions where relevant, model slippage cautiously, and check whether the assumed entry and exit prices are plausible for the order type. A useful stress test asks whether a result survives less favorable execution conditions, rather than assuming every simulated order receives the ideal fill.
The fragile candidate may still be worth investigating, but its impressive in-sample result isn't enough to justify live automation. The simpler candidate may be the more credible one if its assumptions are transparent and its behavior remains steadier across independent tests. Prefer an auditable result over a spectacular result you can't reproduce.
Operationalizing a Vetted Strategy With Test-First Automation
Validation doesn't end when a strategy leaves the simulator. A live workflow needs to show what arrived, what the automation interpreted, what was submitted, and how the broker handled the order.
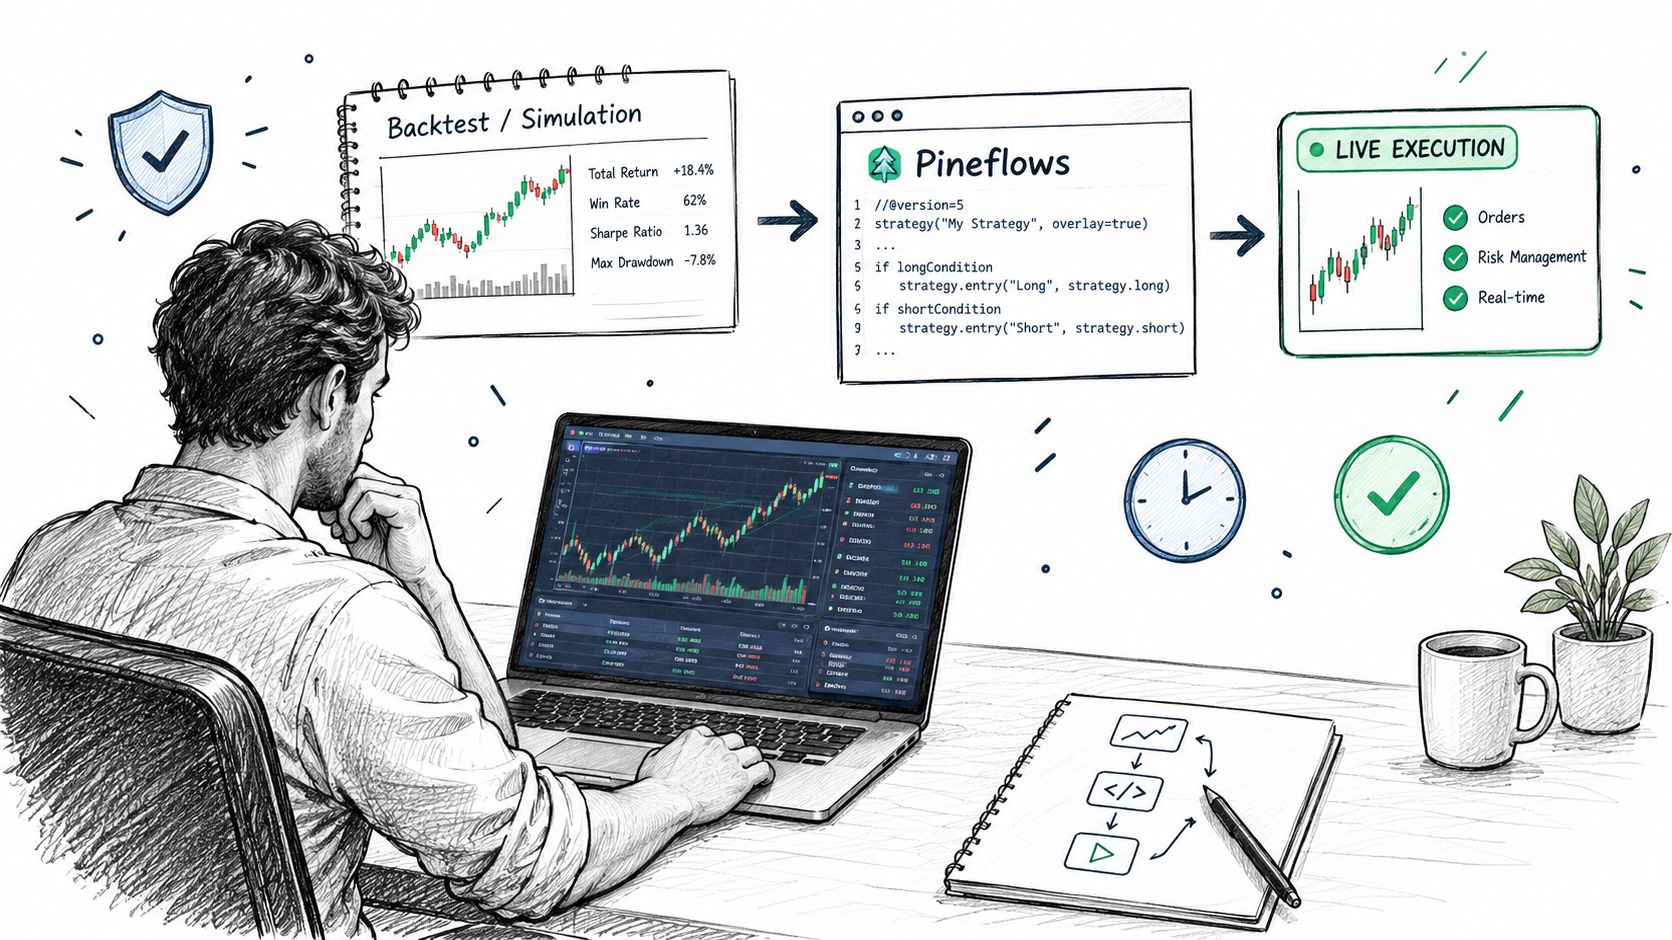
Start with a test-first deployment. Route TradingView alerts to a webhook and inspect the payload before enabling order submission. A default test mode should log incoming events without sending orders to the broker, giving you a chance to confirm that the alert carries the intended instrument, action, and sizing information.
An automation layer should preserve the tested strategy logic rather than rewriting it. Pineflows, for example, converts TradingView alerts from Pine Script strategies into Robinhood orders and offers a test mode that logs alerts before live order submission. Its Claude connector can interpret Pine Script and propose entries, exits, instruments, and sizing for review; those proposals should be checked against the strategy's actual rules before use.
Make every alert traceable
Assign each alert an event ID and use it to prevent duplicate submissions. Idempotent handling matters when delivery is repeated or arrives out of order. A pause control should block new entries when needed while preserving valid exits for risk handling, rather than disabling every action indiscriminately.
The audit trail should connect the alert to the resulting broker event. Record the signal time, payload, submission status, broker response, and fill details. Compare the fill with the expected backtest price, then classify any difference as a possible issue with latency, slippage, missed signals, duplicate alerts, or sizing. The purpose isn't to label every deviation as a system failure. It's to make the deviation diagnosable.
A controlled rollout also needs an explicit point at which test mode ends and live trading begins. Verify that the intended rules are frozen, the alert payload is understood, and the pause mechanism behaves as expected before enabling orders. For a closer look at automated trade execution, focus on the operational path from alert delivery to broker status, not just the final position.
The video below provides another view of the strategy-to-execution workflow.
Reliable routing can reduce operational uncertainty, but it can't repair a strategy selected through data-mining. Automation earns its place after validation, when the live system can explain what it did and provide enough evidence to compare its behavior with the backtest.
A Practical Pre-Live Checklist for Any Backtested Strategy
A strategy should earn its way into live execution. Before switching on orders, make sure the test has a clear record of how the candidate was selected and how its signals will be observed once they leave TradingView.
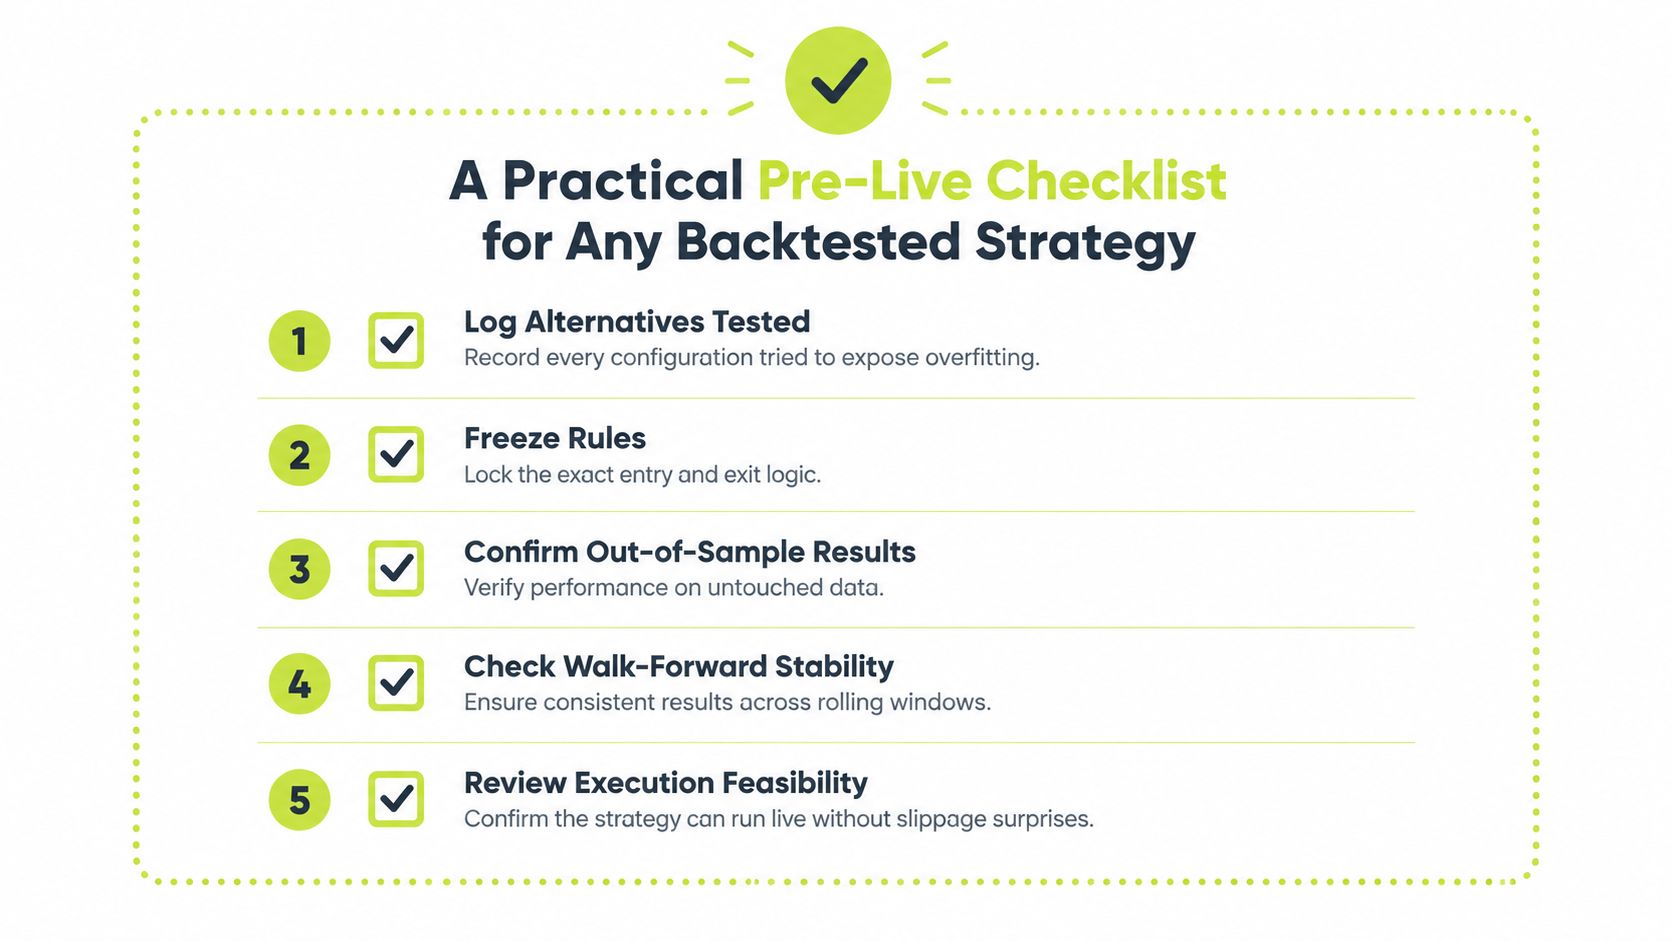
Use this checklist before the live switch:
- Log alternatives tested: Keep a record of rule sets, parameters, timeframes, and other configurations explored.
- Freeze the candidate: Save the exact code, settings, entries, and exits you intend to evaluate.
- Confirm out of sample: Test against data that wasn't used to develop or revise that candidate.
- Review walk-forward behavior: Check whether results remain credible as the evaluation period moves forward.
- Verify execution observability: Confirm that alerts, submissions, broker statuses, and fills can be reconciled.
| Check | Why It Matters | Done? |
|---|---|---|
| Alternatives documented | Makes selection risk visible | ☐ |
| Rules and parameters frozen | Prevents untracked changes during confirmation | ☐ |
| Untouched data tested | Checks whether the candidate generalizes | ☐ |
| Walk-forward results reviewed | Shows how behavior varies across periods | ☐ |
| Alert and fill audit trail ready | Helps attribute live deviations | ☐ |
A test-first execution layer can help keep the handoff observable, but the strategy still needs independent validation. Compare live events with the expected signal and fill assumptions before deciding whether to continue, pause, or revise the system. When you revise it, treat the new version as a new candidate and preserve the history of what changed.
Pineflows' Pineflows Pilot plan costs $29 per month, and its 7-day trial begins after onboarding. The practical value of a live workflow is not that it makes a backtest certain. It's that recorded alerts and order statuses give you evidence to inspect after the strategy leaves the simulator.
Pineflows turns TradingView strategy alerts into Robinhood orders, with test mode, event checks, pause controls, and an audit trail for reviewing what happened. If you're ready to move a vetted strategy toward live execution without losing sight of its behavior, visit Pineflows and review the workflow before enabling orders.