October 29, 2026 · 15 min read · Pineflows team
Algo Trading Strategy: Types, Testing and Execution
Learn the main algo trading strategy types, how to backtest them, and how to run alerts into live orders without losing track of what happened.
You built a Pine Script strategy, the backtest looks clean, and the next alert is about to fire while you're away from the screen. The chart says buy. Your broker hasn't seen an order yet. Between those two moments the price can move, the webhook can arrive twice, or the session can close. An algo trading strategy is only as good as the path from that signal to a fill you can audit.
Treat the strategy as that path, not as a set of entry rules alone. The rules decide the trade. The pipeline decides whether the trade you tested is the trade you got.
Table of Contents
- Algo Trading Strategy Families and Which One Fits
- How Momentum and Mean Reversion Rules Work
- Market-Making and Execution Algorithms in Practice
- Costs and Delays That Turn Backtests into Losses
- How to Design and Backtest a Strategy Step by Step
- Running Alerts into Live Orders Without Surprises
- Monitoring Live Fills and Deciding When to Pause
- Confirm the Pipeline in Test Mode Before Going Live
Algo Trading Strategy Families and Which One Fits
An algo trading strategy is a fixed rule set that decides when to enter, when to exit, and how much to trade. Software carries those rules out. Think of a recipe. The same ingredients and the same steps produce the same dish every time, which is what makes the result testable instead of a one-off hunch.
That recipe is already how most U.S. equity volume trades. In a 2014 assessment, the U.S. Securities and Exchange Commission stated that algorithmic traders, including high-frequency trading firms and a large share of institutional traders, likely represented well over a majority of U.S. equity trading volume. The same assessment cited estimates that high-frequency trading, only a subset of algorithmic trading, accounted for more than 50% of total U.S. equity volume. High-frequency trading means extremely rapid order submission, cancellation, and execution. Broader algorithmic trading also covers slower rules for entries, exits, and working a parent order into slices. Market data doesn't consistently mark each order as manual or algorithmic, so the exact share is hard to pin down. Automated rules are still a normal participant, which is why a live system needs deterministic logic, timestamps, and a guard against duplicate orders.
Five families side by side
| Strategy family | Core logic | Typical holding period | Requirements | Main risk |
|---|---|---|---|---|
| Momentum (trend following) | Buy assets trending up, sell or short those trending down | Days to months | Liquid markets, trend indicators, patience through drawdowns | Whipsaws in sideways markets |
| Mean reversion | Bet that a stretched price returns toward its average | Hours to days | Range-bound behaviour, tight risk stops | Breakouts that keep trending against the position |
| Market-making | Quote a bid and an ask and earn the spread | Milliseconds to seconds | Low latency, exchange access, inventory limits | Adverse selection and inventory risk |
| Execution algorithms (VWAP, TWAP) | Split a large order into slices over time | Minutes to hours | Order size larger than normal volume, a volume profile | Market impact if slices are poorly timed |
| Statistical arbitrage (pairs) | Trade the spread between two historically related assets | Days to weeks | Stable historical relationship, many pairs for diversification | The relationship breaks permanently |
Match the family to the holding period and the data you have, not to the strongest backtest headline. A daily momentum rule on a liquid ETF fits a retail account with end-of-day bars. Quoting both sides of the book for milliseconds does not. Pick the row you can operate, then test that logic with real costs before you route a single live order.
How Momentum and Mean Reversion Rules Work
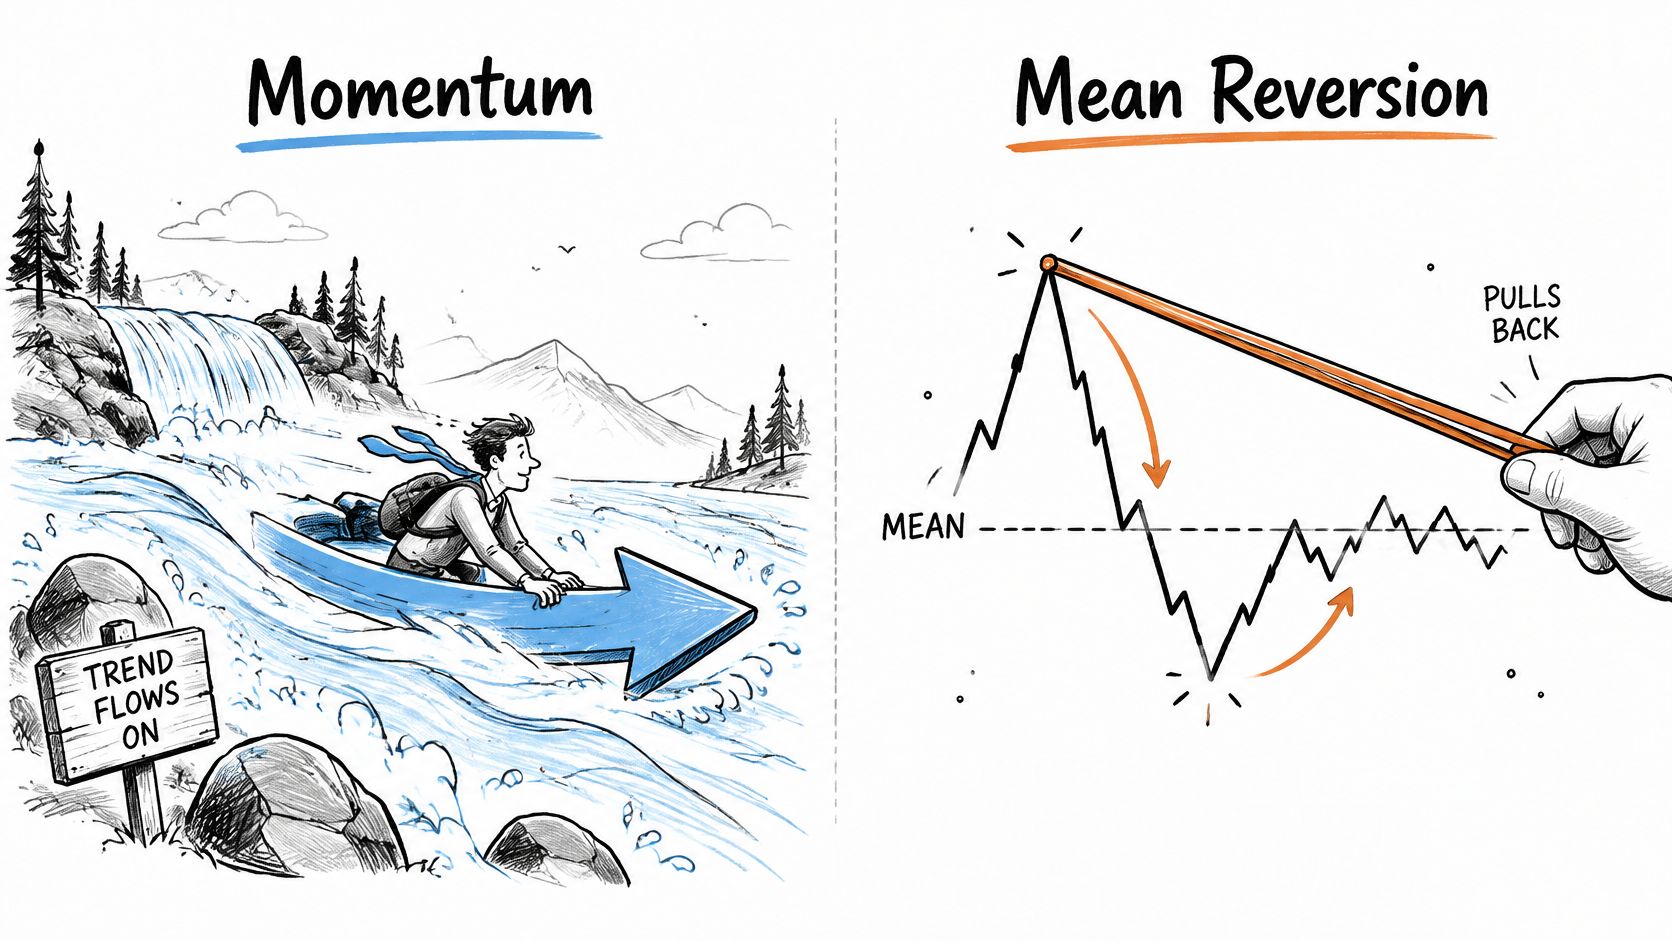
Momentum is a river current. You get in while the flow is running and you get out when it fades. Mean reversion is a rubber band. A price stretched far from its middle is expected to snap back. The two ideas disagree about the next bar, so you can't run both on the same signal and call it diversification.
A momentum rule you can code
Say the rule is a moving-average cross on a liquid ETF. Buy when the 50-day average closes above the 200-day average. Exit when the 50-day average closes back below the 200-day average. Position size is a fixed dollar amount, not a feeling about how strong the cross looks.
That rule catches long trends. It also loses repeatedly when price chops sideways and the averages cross back and forth. In a choppy year the win rate can sit below half of all trades. The strategy only pays if the average winner is larger than the average loser. If you close winners early because a green day feels "enough," you've removed the part that pays for the whipsaws.
A mean-reversion rule you can code
A short-horizon version looks like this. Buy when a 2-period RSI closes below 10 and price is still above its 200-day average. Exit when price closes above its 5-day average. The long average is a filter so you're buying dips inside an uptrend, not catching a falling knife in a bear market.
The filter doesn't replace a stop. If the rubber band snaps the wrong way, the exit average can sit far above your entry.
When each rule fails
Momentum works when moves persist. Mean reversion works when moves overshoot and come back. The same symbol can reward one and punish the other as the regime changes. A momentum cross fails at sharp turning points, because the averages lag the reversal and you're still long after the trend has broken. Mean reversion fails on a news-driven breakout, because a stretched price can keep going. That's why a stop-loss is essential on the rubber-band trade. Without it, one headline can erase a year of small wins.
Practical rule: Before you trust either rule, count trades per year and split results by regime, such as trending months versus sideways months. A rule with a handful of trades, or all of its profit in one regime you can't name in advance, isn't ready to automate.
A short walkthrough of how a simple moving-average idea is built, and where it breaks, is worth watching before you freeze any parameters.
Market-Making and Execution Algorithms in Practice
A market maker posts a bid and an ask at the same time and keeps the gap between them as the spread. Inventory is the uncomfortable part. If buyers keep lifting the ask, the maker ends up short into a rising market. If sellers keep hitting the bid, the maker ends up long into a falling one. Inventory limits exist so that one-sided flow doesn't turn a tiny spread into a large directional bet.
Adverse selection is the other leak. An informed trader hits your quote just before the price moves, and you lose on that fill. Spreads widen around news because makers refuse to stand still while that information arrives. The infrastructure behind this, sub-millisecond links and co-location at the exchange, is out of reach for almost every retail account.
Automated participation is already the norm in futures, not only in equities. A U.S. Commodity Futures Trading Commission study of Chicago Mercantile Exchange data found automated trading often well over half of total trading, and generally proportional to each contract's overall activity. Separate CFTC research on thirty U.S. commodity-futures contracts from January 2013 through December 2018 found average automated-order participation rose by 19% in energy, metals, grains, oilseeds, and livestock. You can use the idea of careful order handling without pretending you are that participant.
Slicing a large order
Execution algorithms don't forecast direction. They work a size you already want.
- TWAP splits the order evenly across time.
- VWAP splits it in proportion to the usual volume profile, so more shares go out when the market is usually busier.
- Implementation shortfall front-loads the order when urgency is high and waiting itself is the risk.
Say you need 10,000 shares and you don't want one print to shove the price. Send ten slices of 1,000 shares, twelve minutes apart. If a slice would land in the opening minute or the closing minute, skip that slot. Spreads are usually widest then, and a marketable order pays the wide side.
What a retail strategy can take from this is modest and useful. Slice anything large relative to recent volume. Prefer a limit when the price can wait. Use a market order only when missing the trade is worse than paying the spread. The path from alert to that order is covered in our guide to trade execution software.
Costs and Delays That Turn Backtests into Losses
A backtest that fills at the bar close assumes a price no trader can reliably get. Gross return and executable return are different numbers.
Say an alert fires at $50.00 and the market order fills at $50.12. That's 0.24% of price, and $120 on 1,000 shares. A strategy whose average trade is only 0.2% just lost money on a "correct" signal. One bad fill is a warning. A pattern of them is the strategy.
The SEC's 2020 staff report on algorithmic trading reports that algorithmic trading generally tightens quoted spreads and reduces effective trading costs for retail investors. The same report cites research finding that high-frequency trading can increase price impact for large institutional orders above approximately $2 million while reducing costs for smaller institutional trades. Order size relative to daily dollar volume matters more than how strong the signal feels. A retail order is rarely in that large-order bucket, but a thin ETF can still move when your size is a big share of the minute's volume.
What to log on every alert
Implementation shortfall is the difference between the decision-time benchmark price and the realized execution price. You can't compute it from a backtest equity curve. You compute it from the live ticket.
| Cost or delay source | Typical effect on a fill | What to record |
|---|---|---|
| Bid-ask spread | A market buy fills above the mid-price and a sell fills below it | Bid and ask at alert time and at fill time |
| Slippage | Fill price moves away from the alert price during fast markets | Fill price minus the decision benchmark price |
| Commissions and regulatory fees | Small trades can lose most of their edge to fixed costs | Fees charged per fill |
| Webhook and processing latency | Price moves before the order reaches the broker | Alert time versus submission time |
| Partial fills | Position ends up smaller than the planned size | Filled quantity versus requested quantity |
| Price impact | Large orders push the price against the trader | Order size as a share of average daily dollar volume |
Market orders cut the chance of not trading at all. They also expose you to the spread and to price impact when liquidity is thin. Size the position from expected dollar volume, not from signal strength alone.
Rerun the strategy with doubled slippage, a one-bar delay, and a commission on every fill. Keep it only if the risk-adjusted result still looks acceptable. If it only works with perfect fills at the alert price, it doesn't work.
How to Design and Backtest a Strategy Step by Step
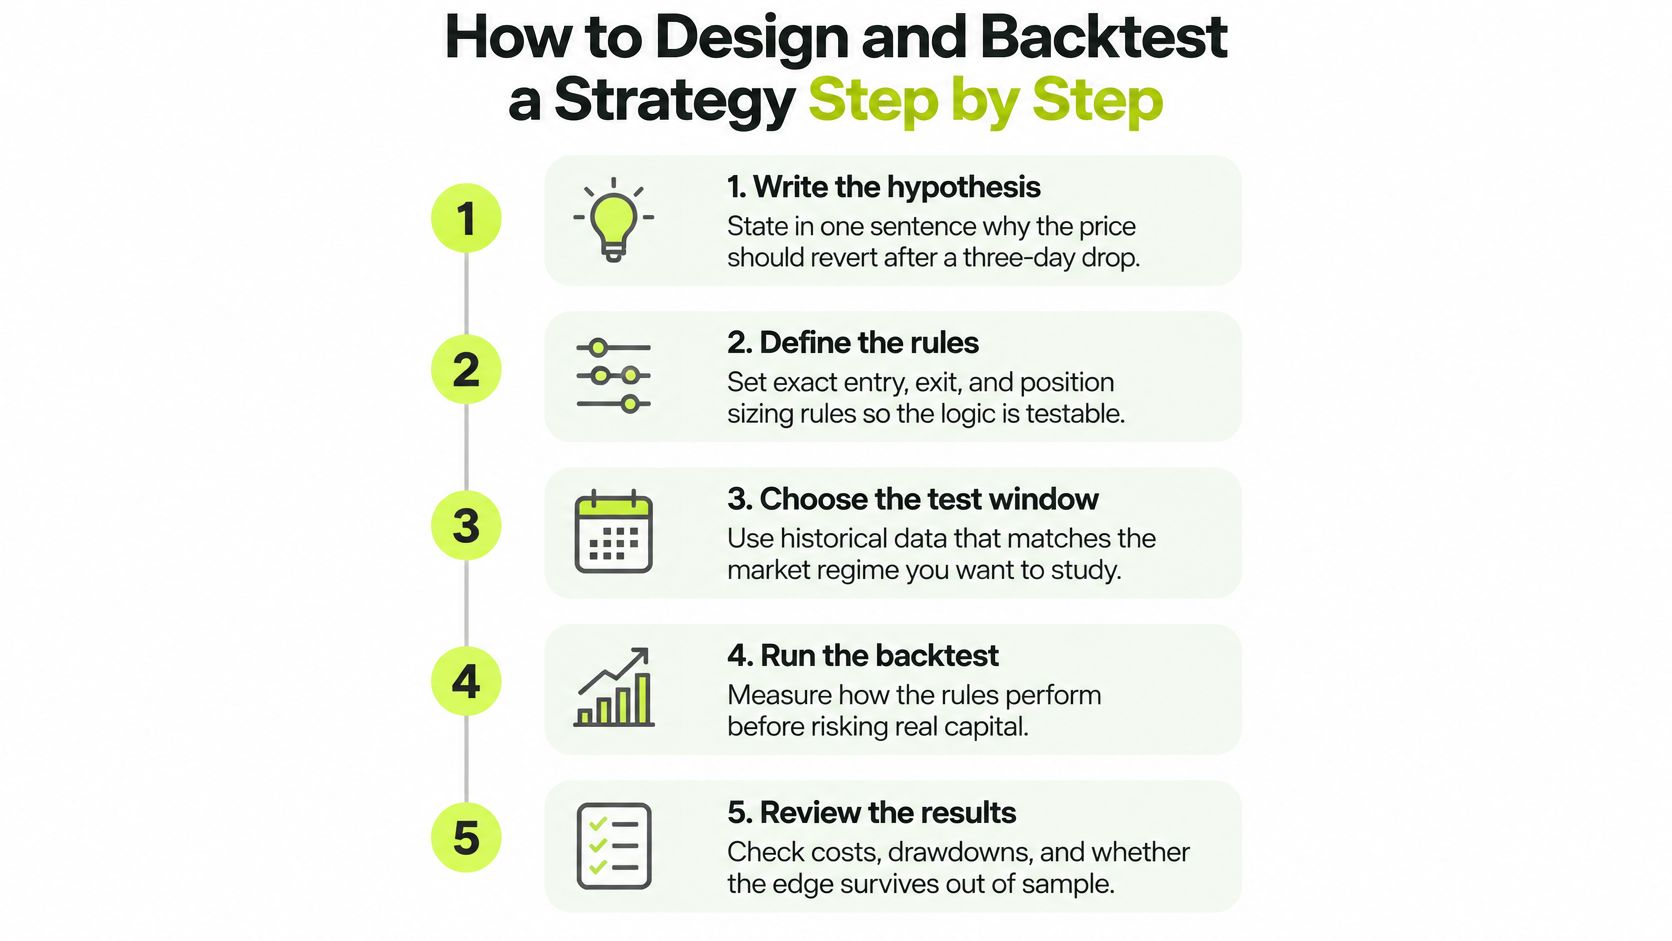
A backtest is a rehearsal, not a forecast. Backtest overfitting happens when repeated trials make a strategy look strong on the data used to build it, while its performance weakens on new data. The more combinations you test, the greater the chance that the apparent winner reflects quirks in the sample rather than a repeatable edge. Keep a record of how many versions you try, not just the one you select.
- Write the hypothesis in one sentence. For example: “Price tends to bounce after a three-day drop while it remains above its long average.” If you cannot explain the reason for the rule, it may be a curve fit looking for a story.
- Define entry, exit, stop, and size in code. Each rule should be clear enough for another person to implement without asking what you meant. Decisions made by judgment at the keyboard are not testable rules.
- Split the history into three blocks. Use development data to build the idea, validation data to check it, and an untouched holdout for a final evaluation. Do not use the holdout to tune parameters.
- Include costs in the first run. Account for commissions, spread, and slippage using the kinds of fields you would log during live execution. A frictionless backtest describes a different strategy.
- Walk forward. Re-estimate parameters on a rolling window, then test those settings on the next slice of data. A single in-sample optimum is not enough.
- Count the trials. Five entry lengths, four stop distances, and three timeframes create 60 configurations. Report the count, because the best result among many trials can look better than it is.
- Compare with simple benchmarks. Check buy-and-hold and a constant-risk version of the same entries. Use a meaningful sample, around 100 trades, and cap size by liquidity.
- Freeze the logic. After the holdout test, do not change parameters and keep calling the result a pass. Discard a failed hypothesis rather than massaging it until it works. Each quiet tweak is another trial.
A review of trading ideas can help pressure-test the hypothesis before using the holdout. Once the rules are frozen, check how they translate into alerts and orders. Test mode logs incoming alerts without sending them to the broker, giving you a way to inspect the execution trail before switching to live trading.
Running Alerts into Live Orders Without Surprises
The common picture is wrong. An alert doesn't arrive once, and it doesn't fill at the alert price a moment later. It travels through several systems, any of which can delay it, repeat it, or drop it.
The path, in order, looks like this. A Pine Script strategy fires an alert. The alert hits a webhook. A rules layer applies position size and long-only logic, so a short signal flattens rather than opening a short. The broker receives a market order in a U.S. equity or ETF. A status log records each stage. We built Pineflows for that path from TradingView to Robinhood, and the controls worth demanding are specific.
- One webhook per automation. You create one TradingView alert and point it at the URL you were given.
- Test mode first. Alerts are accepted and logged, and they are never sent to the broker until you switch to live mode.
- A unique event ID on every alert. The same alert never trades twice.
- A pause that is picky. Pausing blocks new entries immediately, cancels our own open entry orders, and keeps valid exits available.
If an alert arrives and no order is placed, the signal log should name the reason. Paused, duplicate, test mode, plan needed, or Robinhood not connected. A silent skip is how a strategy drifts from the backtest without you noticing.
When the broker is simply down
This isn't hypothetical. Robinhood's regulatory filing reports that an August 5, 2024 outage prevented customers from executing trades during an overnight session. A pipeline has to assume the broker may be unavailable, and that your exit may be the order that doesn't get through.
| Failure mode | What happens if unhandled | Safeguard |
|---|---|---|
| Duplicate alert | The same signal opens two positions | Unique event ID with one order allowed per alert |
| Delayed webhook | Fill lands far from the alert price | Logged timestamps and a maximum acceptable delay |
| Broker rejection | Signal is missed with no position and no notice | Status log that names the rejection reason |
| Partial fill | Position is smaller than the strategy intended | Tracked filled quantity and recalculated exits |
| Connectivity loss | Exits do not reach the broker during a fast move | Alert queue checks and a manual exit procedure |
| Market closure or halt | Orders sit unfilled or are rejected | Session check before routing |
| Symbol mismatch | Trades the wrong instrument | Ticker verification in test mode |
| Entries continue after risk limit | Risk keeps rising past the planned maximum | Global pause that blocks new entries and keeps valid exits |
Graceful failure beats a faster signal. Stopping new entries while valid exits still go through is the feature that limits damage. Another entry in a broken session is not.
You still have to watch the automation. Alerts can arrive late, twice, or not at all. Markets move. Brokers reject orders. The log tells you which of those happened. It doesn't remove the need to look.
Monitoring Live Fills and Deciding When to Pause
Two pauses get confused, and they answer different questions.
An operational pause is the pipeline control. You use it when the broker, the webhook, or a risk limit misbehaves. New entries stop. Valid exits stay open so a position you already have can still be reduced.
A strategy pause retires the logic. You use it when live behaviour no longer matches the frozen test, even though every order went through. The pipeline did its job. The hypothesis didn't.
Four rolling checks
Compare each one with the frozen test, not with last week's mood.
- Average slippage per fill. Set the limit in the stress test before you go live. A fill worse than that limit is a warning. The same gap on fill after fill is a reason to pause.
- Trade count per month. A large shortfall versus the backtest means signals aren't firing as tested. You may be in a different regime, or alerts may be getting dropped.
- Realized drawdown. Measure it against the maximum loss you wrote down before the first live order. That number doesn't get revised after a bad week.
- Fill rate and partial-fill share. A falling fill rate shrinks the position you thought you had. Exits sized for the full quantity are then wrong.
Review the four measures after every 20 alerts. Write the pause thresholds down first. A paused strategy stays frozen. Any change to an entry, a stop, or a size restarts the test-mode cycle, because retuning after losses is a new hypothesis, not a repair.
Confirm the Pipeline in Test Mode Before Going Live
Going live is a yes or a no, not a vibe. Work this list in order. Skip an item and you're guessing.
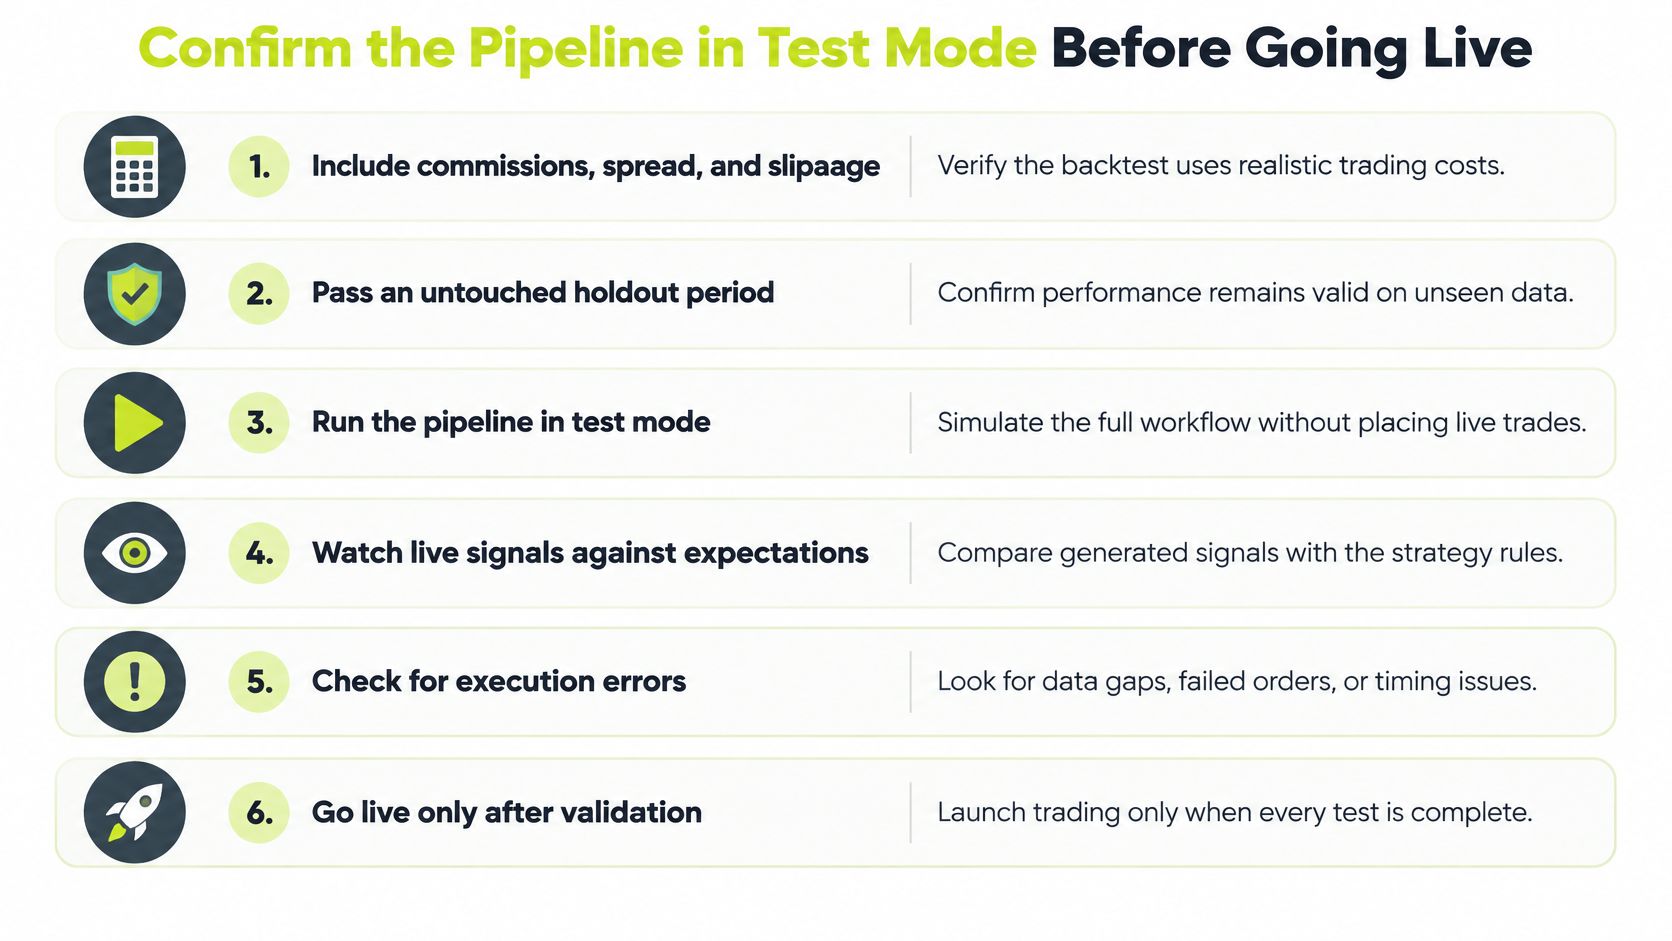
- Costs and holdout. The backtest includes commissions, spread, and slippage, and it passed an untouched holdout period.
- Frozen logic. The rules are locked, and you've written down how many configurations you tested.
- Payload check. In test mode you verified the alert payload, event ID, order direction, and quantity, including the ticker. A test alert that leaves placeholders blank is not a real fill, so don't count it as one.
- A reviewed sample. You read the log for a set of alerts, about 20, and every one shows the outcome you intended.
- Pause drill. With one open entry order and one open exit, you confirmed that new entries stop and the exit still reaches the broker.
- First live alert. You watched it from alert time to fill time, and you logged the slippage.
What has to be true on the account
Webhooks need a paid TradingView plan with two-factor authentication enabled. You also need enough buying power and a valid Robinhood connection. Setup is one sitting and four steps: sign in with Google, connect Claude, create one TradingView alert, and review, then go live. If you want the rehearsal before any of that routing, start with how to paper trade in TradingView.
The Pineflows Pilot plan is $29 per month, with a 7-day trial that starts after onboarding. We execute the strategy you already tested. We don't make it profitable, and you won't see a projected return on the platform.
Go live only when the test log shows every alert behaving as intended. Pause immediately if any fill drifts past the slippage limit from your stress test. Pineflows is not investment advice, trading involves risk of loss, and a backtest is not a forecast.
Pineflows turns TradingView alerts from a Pine Script strategy into Robinhood market orders, with test mode, event IDs, and a pause that blocks new entries while valid exits stay open. If your algo trading strategy is frozen and you want an auditable path from alert to fill, review the log before you switch anything live. Visit Pineflows and run the first alerts in test mode.