October 31, 2026 · 14 min read · Pineflows team
Trend Follower Strategy: Rules, Risk and Automation
Learn how a trend follower strategy works, which indicators and entry rules to test, how to manage risk and drawdowns, and how to automate it safely.
The most popular advice about trend following is also the easiest part: buy strength and sell weakness. But an entry rule can look compelling in a backtest and still disappoint once trading costs, choppy markets, and missed or repeated alerts enter the picture. A workable trend follower strategy isn't just a signal. It's a complete set of rules for entering, exiting, sizing positions, and handling execution.
Trend following doesn't predict the next move. It reacts to price behavior, accepts that some signals will fail, and aims to stay with the moves that persist. The practical question isn't only which rule to choose. It's whether you can follow it through losing streaks and whether its potential edge remains after the costs of trading it.
Table of Contents
- Trend Following Explained in Plain Terms
- Entry Indicators and Rules Compared
- How to Set Entries, Exits and Position Size
- Managing Drawdowns and Whipsaw Periods
- Backtesting Net of Real Trading Costs
- Backtesting Without Overfitting
- Confirm the Rules Before You Go Live
- How to Automate a Tested Trend Follower
Trend Following Explained in Plain Terms
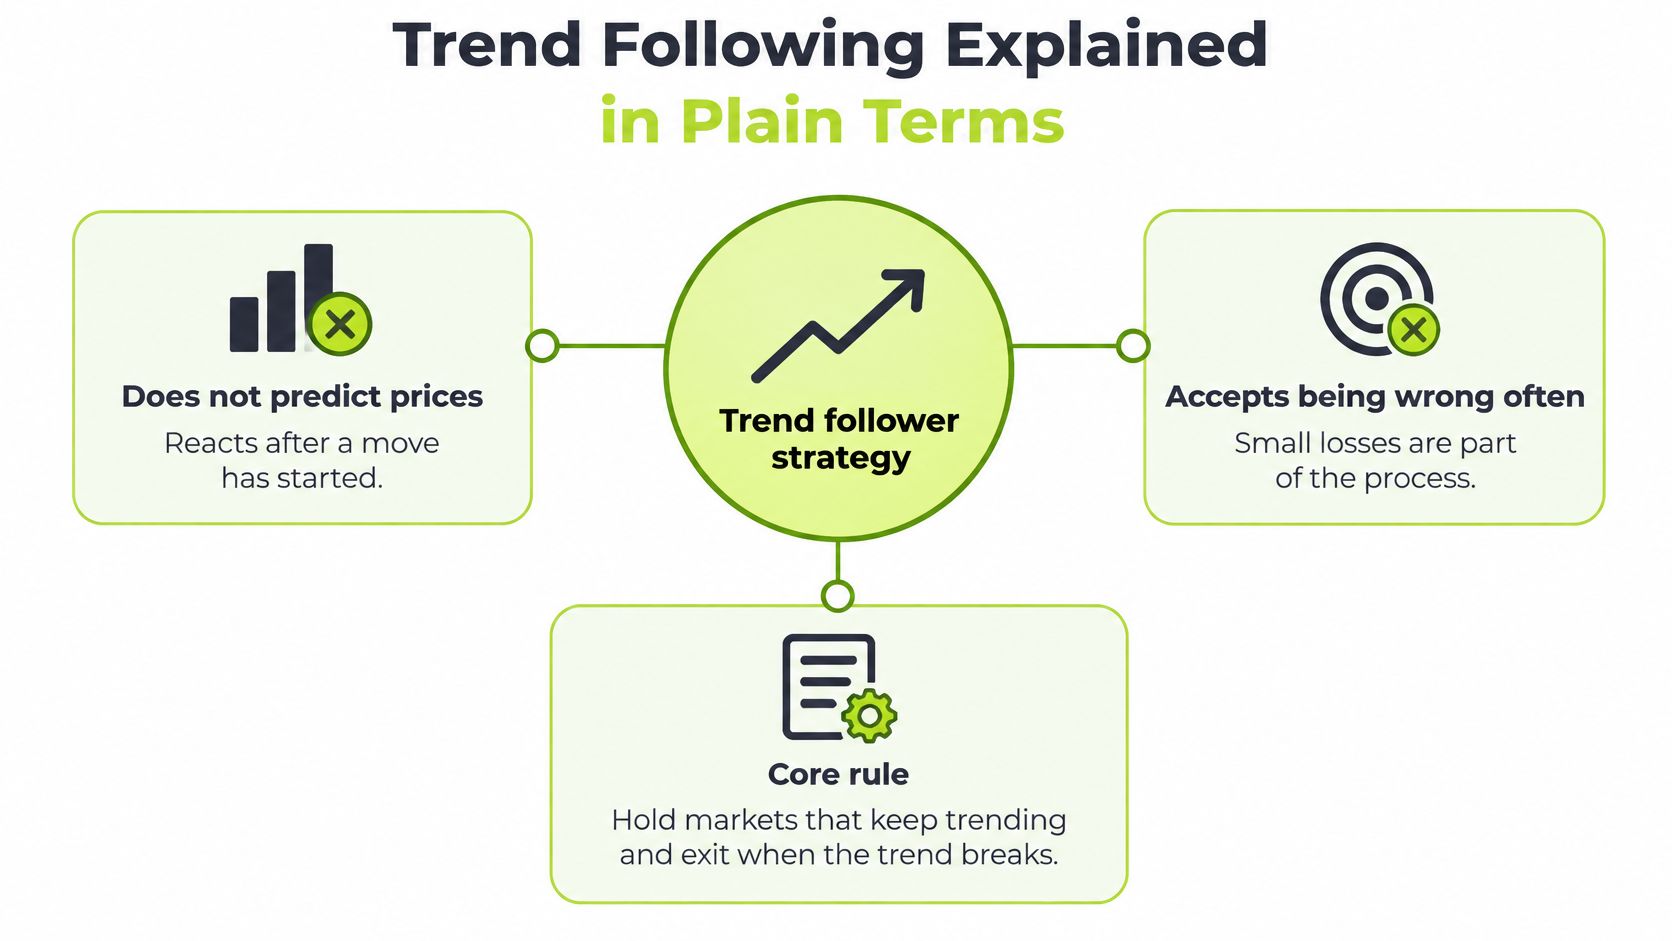
A trend follower doesn't try to call the market's next turn. The core rule is simple: hold markets with positive recent performance and avoid or short markets with negative recent performance. The strategy waits for evidence that a move is underway, then follows it until the signal weakens or reverses.
Think of a surfer waiting for a wave to build rather than guessing where it will break. The surfer gives up the chance to catch the very beginning of the wave in exchange for a better chance of riding a move that has already formed. Trend followers make a similar trade-off. They can enter late, exit after some gains have faded, and still be wrong often. Many trades are small losses caused by false starts, while a smaller number of sustained moves can account for a large share of returns.
What long-run evidence can and can't tell you
A study by Hurst, Ooi, and Pedersen examined time-series momentum, often called trend following, across 67 global markets from January 1880 through December 2016. The sample included commodities, equity-index markets, bonds, and currencies, using an equal-weighted combination of one-, three-, and twelve-month signals; the strategy bought markets with positive recent performance and shorted those with negative recent performance. The study of a century of trend-following evidence reported 18.0% gross annualized returns and an estimated 11.0% net annualized return after fees, with annualized volatility of about 9.7%.
Net returns were positive in every decade in that historical sample, but that doesn't make the strategy a sure thing. The figures come from a backtest, and actual results depend on implementation, costs, and future market behavior. A long record helps show that the idea has been tested across many conditions. It can't promise that a particular rule, account, or trader will earn a profit.
A trend follower accepts frequent false starts in exchange for the chance to hold a move that lasts. Does a strategy that loses often but holds winners for a long time fit how you can actually trade?
Entry Indicators and Rules Compared
There's no single entry rule that works best for every market or trader. Each approach makes a different trade-off between reacting quickly and getting shaken out by a move that doesn't last.
| Rule | Entry signal | Typical settings | Strengths | Weaknesses |
|---|---|---|---|---|
| 20/50-day moving average crossover | Fast average crosses above slow average | 20 and 50 days | Simple and widely tested | Whipsaws in sideways markets |
| Donchian breakout | New high or low over the channel | 20-day channel | Captures sustained moves | Late entries after gaps |
| 10-month moving average | Price above or below the average | 10 months | Few trades and low turnover | Slow exits in fast reversals |
| Time-series momentum | Sign of past return | 1, 3 and 12 months, equal weight | Broad evidence across markets | Needs a diversified universe |
| ATR channel | Breakout beyond the ATR band | 14-day ATR, 2 to 3 times ATR | Adapts to volatility | Sensitive to parameter choice |
How the rules behave
A 20/50-day moving average crossover is easy to understand and test. It enters when the faster average rises above the slower one, but in a sideways market the averages can cross back and forth, producing repeated losses.
A 20-day Donchian breakout looks for a new high or low over the channel. It can catch a persistent move, but a sharp gap can leave the entry far from the price that first started the breakout.
The 10-month moving average takes a slower approach. It tends to generate fewer signals, which can keep turnover down, but it may be slow to exit after a fast reversal. That lag is part of the trade-off, not a glitch that disappears when the rule is automated.
Time-series momentum measures whether past returns over several lookback periods are positive or negative. Its broad use across markets is a strength, but a single stock or fund can't provide the same diversification as a wider universe.
An ATR channel sets its breakout band using average true range, a measure of recent price movement. A band at two to three times the 14-day ATR adjusts to volatility, but the choice of settings can change how often the rule trades and how readily it gets whipsawed.
Choose a rule based on the holding period you can tolerate and the cost of executing it. The best-looking single backtest isn't necessarily the rule you can trade reliably after spreads, slippage, and exits are included.
How to Set Entries, Exits and Position Size
A signal tells you when a market meets a condition. It doesn't decide how much to buy, how to exit, or how to prevent one sector from dominating the account. Set those rules before trading so that a strong signal doesn't tempt you to improvise.
Define the universe. List liquid US stocks or ETFs across several sectors, so one company or market theme can't dominate the results. Keep the list fixed while you test the strategy.
Choose one entry rule and settings. Pick a rule from the comparison and lock its parameters before reviewing results. Changing settings whenever a trade disappoints makes it harder to tell whether the rule works or merely fits past prices.
Set an initial stop using volatility. One practical example is a stop at two times the 14-day ATR below the entry for a long position. ATR ties the stop distance to recent price movement instead of using the same price buffer in calm and volatile conditions.
Define the exit before entering. A trailing exit at a 10-day low, or at the moving average that defines the trend, gives a winning position room to continue while providing a specific condition for leaving. In a long-only system, a short signal means exit the position, not open a short sale.
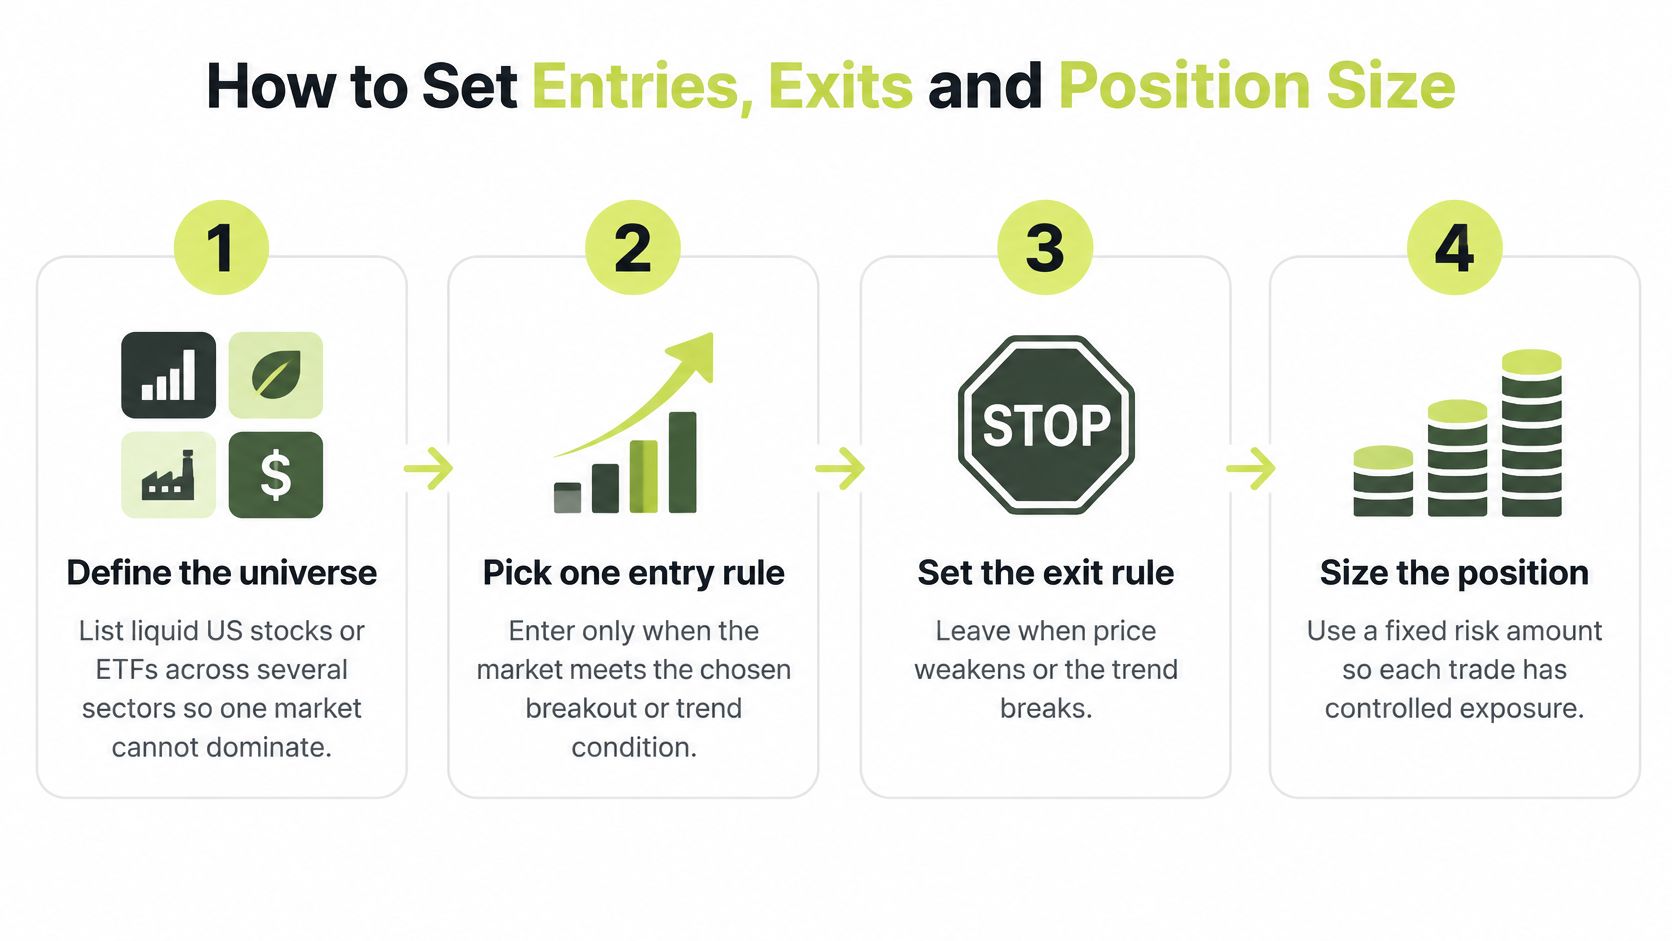
Size the position from the stop distance. Decide how much account equity a stop-out can put at risk, then calculate shares from that amount and the distance to the stop. For a risk budget of 1% of account equity and a stop two ATRs away, the basic formula is: account equity × 1% ÷ (2 × ATR). A smaller risk budget reduces the loss from a single stopped-out trade.
Cap sector exposure. Set a maximum for each sector so several positions tied to the same theme don't behave like one oversized bet. Diversifying tickers doesn't help much if they all depend on the same market driver.
Log the signals, fills, and reasons. Record the market, signal, order details, exit, and whether the trade followed the rules. A healthy log after 30 signals won't need to show a profit; it should show that every event can be checked, mistakes are identifiable, and the strategy hasn't changed midway through the sample.
Entries get attention, but exits determine how much of a sustained move you keep and when you stop carrying a position. A clear rule for both makes performance review more useful than a list of entry signals alone.
Managing Drawdowns and Whipsaw Periods
Trend followers aren't automatically protected in a crisis. Rapid reversals, policy-driven moves, and range-bound markets can be harder than a steady decline because prices change direction before a signal has time to establish itself. By late August 2025, the SG Trend Index was down more than 9% year to date, and Morningstar reported that the typical systematic-trend fund lost 5.8% in the first half of 2025 and was down 2.3% annualized over the three years through August 2025, according to coverage of trend-following performance and market whipsaws.
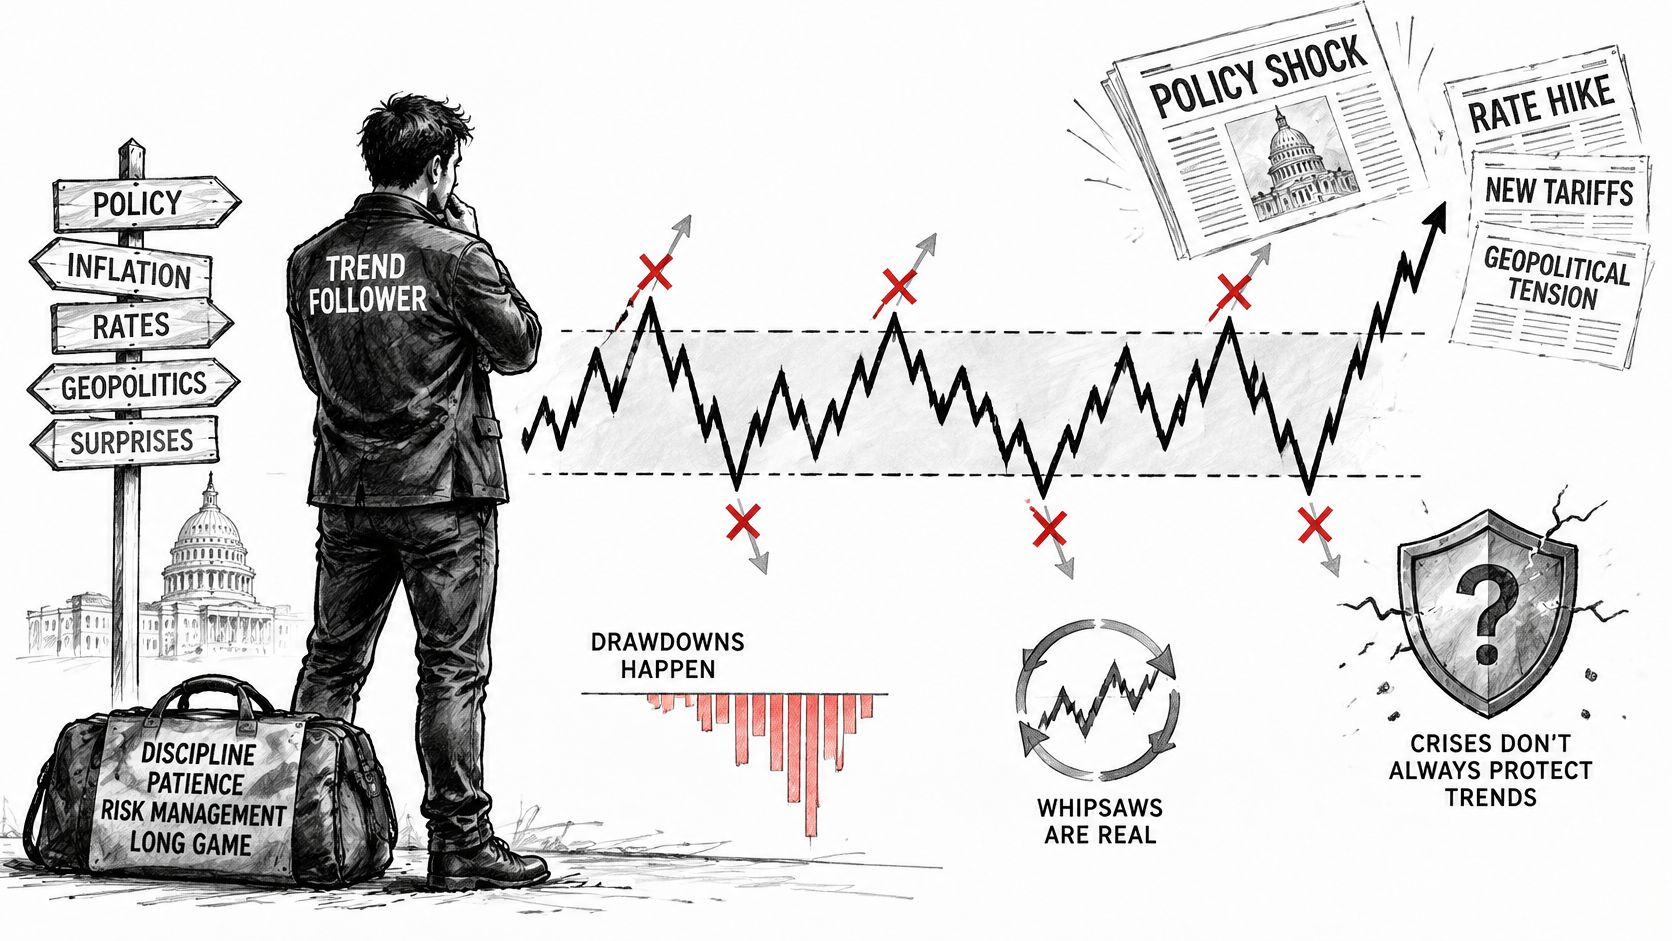
When a market keeps reversing, a signal can prompt an entry just before prices turn again. The system exits, a new signal appears, and another trade begins. Each individual loss may be controlled, yet repeated turnover and execution costs can make the stretch difficult to tolerate. Smoothing a signal can reduce excessive trading during regime changes, although it can also make the strategy slower to react.
Three ways to respond to whipsaws
The first option is to accept the losses as part of the strategy. That only works if the position sizes and drawdowns are small enough for you to keep following the rules.
The second is to reduce exposure with a volatility or regime filter. A filter can scale risk down under specified conditions, but it adds another rule that needs to be tested. Don't add a filter just because a recent losing streak feels uncomfortable.
The third is to pause new entries while keeping risk-reducing exits available. This is a useful default if execution or signal quality has become uncertain, because it limits fresh exposure without treating the original model as permanently invalid. Write down the condition for pausing and for restarting, then keep a record of the signals that arrived while the system was paused.
Operational check: During a whipsaw, check for duplicate signals, stale alerts, the status of every order, and pause conditions written before trading began.
A pause doesn't have to mean abandoning the model. It changes exposure while preserving an auditable record that you can review before resuming. For a broader perspective on how to evaluate your rules, see what makes a good trading strategy.
Pineflows executes the user's strategy but doesn't make it profitable, and users won't see a projected return on the platform. It isn't investment advice, trading involves risk of loss, and a backtest isn't a forecast.
Backtesting Net of Real Trading Costs
A clean backtest can hide a costly strategy. If it assumes fills at the signal price and ignores trading friction, it may show performance that a live account can't reproduce. Costs matter especially when a rule turns over positions often.
A 2025 stock trend-following study reported a 15.19% annualized gross return from 1991 to 2024, but found that extensive daily turnover made the base strategy unattractive for portfolios below $1 million after transaction costs. The same study found that controlling turnover materially improved net performance across portfolio sizes, according to the stock trend-following study on trading costs.
| Cost | How to model it | Example input | Why it matters |
|---|---|---|---|
| Bid-ask spread | Half the quoted spread per fill | Quoted spread, such as 1 cent on a $50 stock | Costs repeat on every entry and exit |
| Slippage | Fill at the next bar plus a penalty | 1 to 3 ticks on market orders | Volatile alerts can fill far from the signal |
| Commissions | Per-order fee | Zero or a small fixed fee per order | Matters most for small accounts |
| Financing or borrowing | Daily cost on leveraged or margin positions | Broker margin rate | Erodes returns on long holding periods |
| Taxes | Short-term versus long-term gains | Your tax bracket and holding period | Frequent exits can create more short-term gains |
Responsiveness has a price
A faster rule may cut lag, but it may also send more orders. For a smaller account, each extra fill can make the cost burden large enough to erase the strategy's edge. This is why the most responsive rule isn't automatically the best one to automate.
For a hypothetical account with 40 round trips per month, the trader places 80 orders. At $1 per order, commissions total $80 per month, or 0.8% of a $10,000 account, before spread and slippage. That example leaves out other costs, so it understates the full hurdle the strategy must clear.
Market orders can also fill at prices far from a backtest's assumed price, particularly when an alert arrives during a sharp move. Liquidity affects how much the execution price drifts, so a test should use the actual instruments and realistic fill assumptions rather than a tidy signal price.
Before automating, estimate expected trades per month, average holding period, and cost per trade. Then check whether the strategy's net expectancy remains positive after those assumptions. The acceptable alert volume depends on liquidity and turnover, not only on a backtest's headline return.
Backtesting Without Overfitting
A backtest is useful only if the rules could have been followed with information available at the time. Apply these checks before adding trading costs, so avoidable biases don't distort the test.
Separate rule-building data from later data. Set aside an out-of-sample period and don't use it to tune the rule. If performance disappears outside the period used to design the strategy, the test hasn't established that the rule generalizes.
Keep parameter searches narrow. Start with a standard setting, then test nearby values to see whether performance holds up. Searching a large grid of moving-average lengths can turn ordinary noise into an apparently perfect setting.
Include the instruments that existed at each point in the test. Using only today's surviving stocks can omit assets that disappeared or fell out of favor, making the historical universe look better than it was.
Avoid lookahead bias. If a signal depends on a bar's closing price, place the hypothetical trade no earlier than the next bar's open. Trading at the same close that generated the signal gives the strategy information it couldn't have acted on.
Check the trade count and compare a simple alternative. A small sample can leave too much uncertainty, so test across markets rather than relying on a handful of trades. Compare the result with holding the same universe, then review the full guide to backtested trading strategies before drawing conclusions.
Confirm the Rules Before You Go Live
Treat a yes-or-no checklist as a gate, not a formality. Automation can send orders consistently, but it can't make an untested rule safer or more profitable.
- Net results: Have you tested the strategy across several liquid markets after including spread, slippage, commissions, financing or borrowing, and taxes?
- Tolerable drawdown: Can you stay with the rules through the largest drawdown in the test without abandoning the strategy?
- Written pause conditions: Did you set triggers in advance, such as a drawdown limit, a volatility spike, or repeated whipsaw exits?
- Out-of-sample results: Did the rule hold up on data you didn't use to choose its settings?
- Realistic trade count: Does expected net expectancy remain positive at the number of trades you expect to make?
If even one answer is no, don't connect the strategy to live orders yet. Pineflows starts in test mode, where alerts are accepted and logged but aren't sent to the broker until you switch to live mode; you should review the alert log before making that change. Live mode is refused until a real alert has been verified, Robinhood is connected, and the free trial or plan is active.
Start in test mode, compare the first signal log entries with the tested rules, and move to live mode only when every checklist answer is yes.
How to Automate a Tested Trend Follower
Automation should carry a tested rule into execution, not substitute for testing. Pineflows turns TradingView alerts from Pine Script strategies into Robinhood orders, so each stage needs a check for the failure that could interrupt or change the intended trade.
Finish the Pine Script strategy in TradingView. Make sure the backtest includes realistic costs before routing alerts; automation scales whatever edge the strategy has. Failure point: a script tuned on the full history without trading costs.
Confirm webhook access and account security. Webhooks require a paid TradingView plan with two-factor authentication enabled. Failure point: a plan without webhook access may not send the alert.
Connect the strategy details. Sign in to Pineflows with Google and connect an AI assistant that reads the script and proposes the instrument, sizing, entries, and exits. Check every proposed parameter against the tested rules, because a proposal isn't a backtest. Failure point: any setting that differs from the strategy you validated.
Create one TradingView alert. Point its webhook to the URL shown in Pineflows and confirm that the alert uses the expected payload. Failure point: a mistyped or outdated webhook URL.
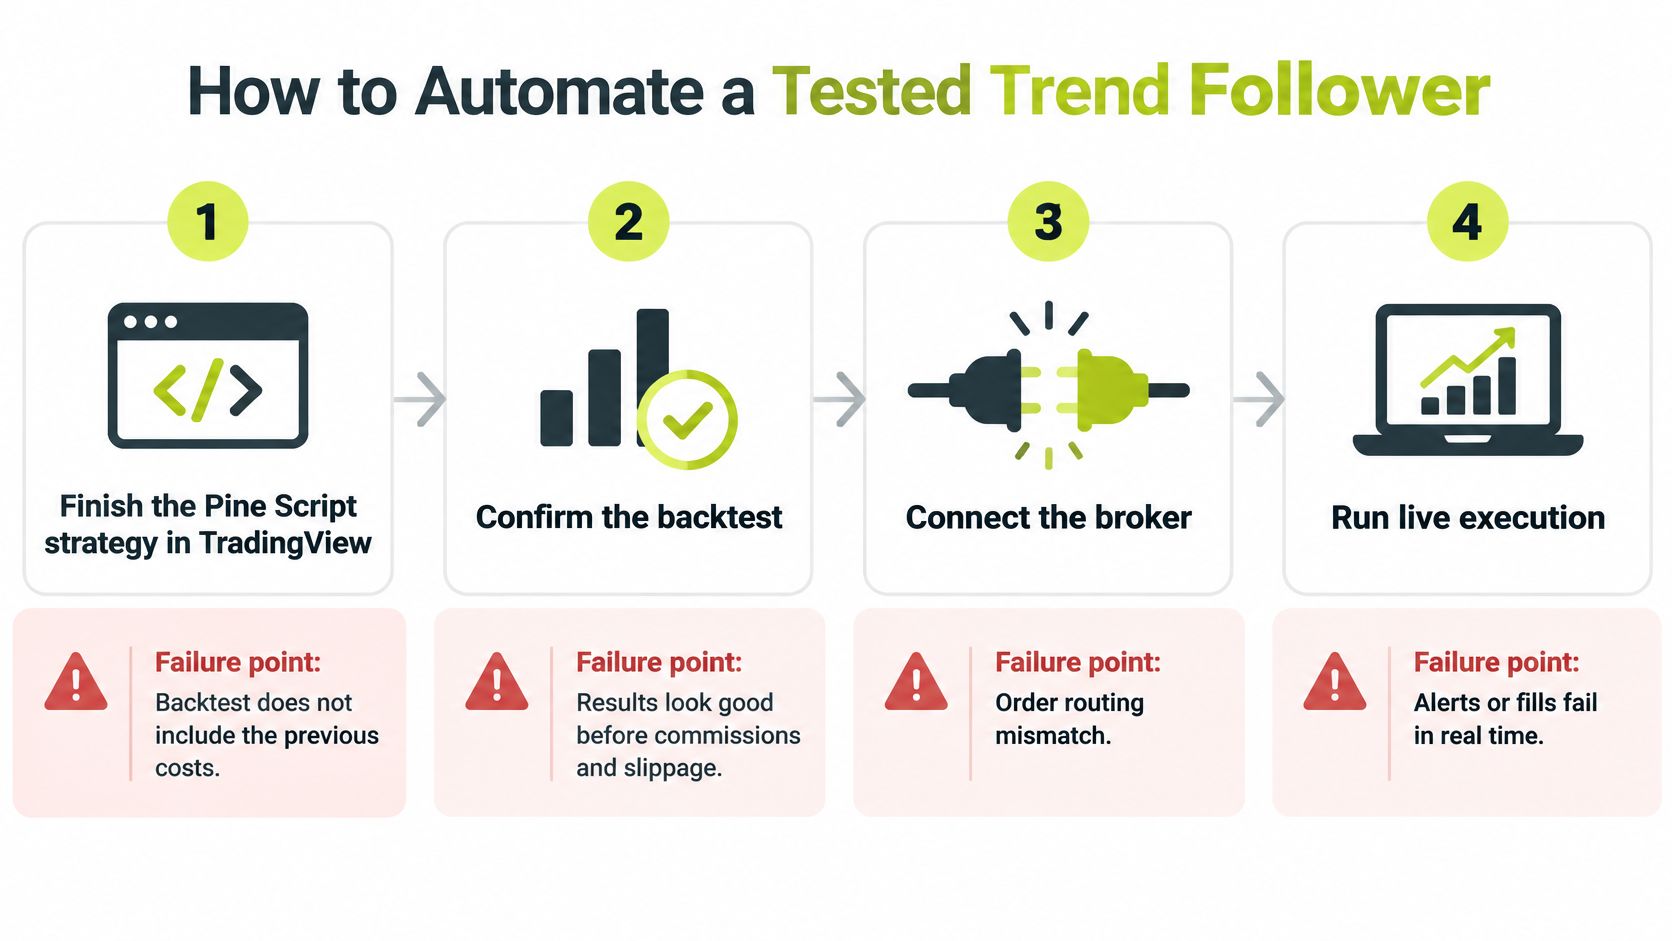
Keep test mode on and inspect incoming alerts. Confirm that each event arrives with the correct ticker, side, and size before allowing broker orders. Failure point: a payload missing a required field or carrying an unexpected value.
Review the signal log. If an alert arrives but no order is placed, the log names a reason such as paused, duplicate, test mode, plan needed, or Robinhood not connected. Failure point: overlooking a logged skip and assuming the intended trade happened.
Switch to live mode only after verifying a real alert. Pineflows executes long-only; a short signal flattens the position instead of opening a short. Orders for US equities and ETFs are market orders, and every alert carries an event ID to prevent the same alert from trading twice. Failure point: assuming duplicate protection can prevent late, repeated, or missing alerts, or a broker rejection.
You still need to monitor the automation because alerts can arrive late, twice, or not at all, markets move, and brokers may reject orders. The TradingView strategy automation guide covers the alert-to-order workflow, but the operating rule stays simple: automation executes the tested strategy; it doesn't replace supervision or make the strategy profitable.
Pineflows turns TradingView alerts from Pine Script strategies into Robinhood orders, with a test-first workflow that lets you review signals before enabling live execution. If you've tested your trend follower strategy net of costs and want to check its alert pipeline, visit Pineflows and start in test mode.