October 28, 2026 · 12 min read · Pineflows team
Trading Ideas Review: Which Sources Deliver Real Edge
Trading ideas review of common idea sources: criteria, cost stress tests and a live-readiness checklist to judge signal accuracy before trading.

Don't choose a trading idea source by its highest win rate or most impressive return chart. Those figures leave out the questions that matter: which losing ideas disappeared, how many settings the author tried, and whether you could have executed the trades at the prices shown.
A useful trading ideas review starts with evidence you can reproduce, not performance you're asked to admire.
Table of Contents
- What a Trading Ideas Review Should Measure
- Trading Idea Sources Compared at a Glance
- Criteria That Separate Real Edge From Noise
- Net Returns After Costs and Benchmarks
- How to Stress-Test a Backtest Step by Step
- Where Automated and AI-Built Ideas Break Down
- Choose a Source Only After a Live-Readiness Test
What a Trading Ideas Review Should Measure
A profitable-looking chart isn't a complete trading record. Without position sizing, losing trades, execution assumptions, and a comparison investment, you can't tell whether the author demonstrated skill or took risk during a favorable period.
Trading ideas usually arrive as a chart with a written rationale, a published Pine Script strategy, a newsletter or alert service, or a personal strategy connected to automated alerts. Each format requires different evidence.
- Chart ideas: Look for an entry condition, invalidation point, exit method, and publication timestamp.
- Published strategies: Inspect the code, settings, trade list, and testing history.
- Signal services: Require a complete record of recommendations, including cancellations and losses.
- Personal automations: Match intended signals to logged events, orders, and fills.
Review standard: Trust requires results that survive costs, hold on untuned data, beat a relevant benchmark over identical dates, and produce a timestamped forward execution record.
This isn't a ranking of named services. An outside reviewer can't establish an undisclosed track record's completeness, recreate private parameter searches, or infer actual fills from screenshots.
Separate screening from approval
A scorecard can tell you whether an idea deserves further testing. It can't establish live readiness before you've collected forward evidence.
Your initial outcome should be practical: identify what's verifiable, mark what's missing, and reject sources that won't provide the information necessary to evaluate their claims. Missing evidence isn't proof of fraud, but it is a reason not to commit capital.
Trading Idea Sources Compared at a Glance
| Source type | What you can verify | Track record visibility | Costs to check | Main risk |
|---|---|---|---|---|
| Free public idea feeds | Chart, author history, written rationale | Partial; inspect the complete author archive rather than popularity rankings | Filtering time; no direct fee for free posts | Survivorship and popularity bias |
| Community Pine Script library | Source code when open, declared settings, parameter list | Treat as backtest evidence unless a forward record is supplied | Commission and slippage declared in the script | Parameters selected after repeated runs |
| Paid newsletters or signal services | Written rationale and any archived alerts | Selected examples aren't a complete record; seek independent verification | Subscription fee and disclosed commission arrangements | Unverified track record |
| Broker or platform idea feeds | Ideas linked to market data and watchlists | No performance record unless dated outcomes are published | Execution costs on that platform | Promotional incentives affecting selection |
| Your own TradingView strategy with alerts | Full code, settings, alert logs | Backtest plus your own forward record | TradingView plan, broker fees, slippage | Your own overfitting and execution gaps |
Read the table as an evidence-access comparison, not a claim that every provider in a category behaves alike. A transparent free author can be more testable than a paid service, while owning the code doesn't make your own strategy sound.
A reading rule for each source
- Public feeds: Review consecutive posts, not the author's highlighted winners.
- Script libraries: Confirm that published settings reproduce the displayed trade list.
- Paid services: Require the archive before paying for performance claims.
- Platform feeds: Separate useful screening information from an invitation to trade.
- Personal alerts: Check whether your records describe execution, not merely signal generation.
A public feed shows what remains visible. If unsuccessful ideas were removed or abandoned without an outcome, the surviving archive can flatter the author. You can't measure that omission from retained posts alone.
Likewise, a hidden track record is a red flag for a performance-based purchase, not a neutral blank to fill with testimonials.
For studying methods, written chart explanations and inspectable scripts are useful. For screening, prioritize searchable archives and clear setup definitions. For automation, choose a rule you can independently reproduce; our guide to trading signal software helps distinguish idea generation from order routing.
Criteria That Separate Real Edge From Noise
| Criterion | Strong sign | Red flag |
|---|---|---|
| Sample size | Trade count disclosed across different market conditions | Sparse observations or only a favorable trend |
| Out-of-sample result | Positive performance on data excluded from tuning | Profit confined to the fitted period |
| Configurations tried | Search count and selection procedure disclosed | Only the winning configuration shown |
| Parameter sensitivity | Economically viable neighboring settings | Profit disappears after a small input change |
| Net of costs | Commission and slippage included | Gross results only |
| Benchmark | Beats a relevant passive alternative after costs over identical dates | Comparison against cash or selectively chosen dates |
| Drawdown | Losses compatible with account capacity and risk limits | Losses requiring forced liquidation or abandonment |
| Forward live record | Timestamped signals reconciled with orders and fills | Backtest screenshots without an event history |
The least visible row is often the most important: configurations tried. Bailey and López de Prado explain in their Significance analysis of backtest overfitting how selecting an apparently optimal strategy after testing rules, parameters, markets, or periods can produce attractive historical performance without durable skill.
That changes the question you should ask an author. “What settings worked?” is less informative than “What search produced these settings, and what happened to the alternatives?”
Count experiments, not just trades
A large trade list doesn't reveal how aggressively someone searched for it. Changing the symbol, timeframe, stop method, entry filter, or start date creates another opportunity to select a favorable historical result.
Record those choices even when the final strategy looks simple. If the author can't disclose the search history, mark selection risk as unresolved rather than assuming the displayed configuration was the original hypothesis.
Trade count also needs context. Closely clustered signals during a sustained rally don't demonstrate how the strategy behaves through reversals, price gaps, or low-liquidity conditions. Several positions driven by the same market move shouldn't be treated as fully independent evidence.
Protect the unseen sample
An out-of-sample period is history the developer didn't use to select or adjust the rules. Once you inspect that period and change the strategy in response, it becomes part of development rather than an untouched validation.
Parameter sensitivity asks a different question. Test whether nearby settings remain viable instead of depending on an isolated optimum. Passing that check doesn't replace unseen-data validation because neighboring settings still share the same historical environment.
Our criteria for a good trading strategy provide a useful way to organize the specification before evaluating results.
Don't average away a critical failure. Strong historical returns can't compensate for missing execution records or losses your account couldn't absorb.
Require broad support across the scorecard. Treat cost viability, unseen-data performance, and a reconcilable forward record as gates, not optional points.
Net Returns After Costs and Benchmarks
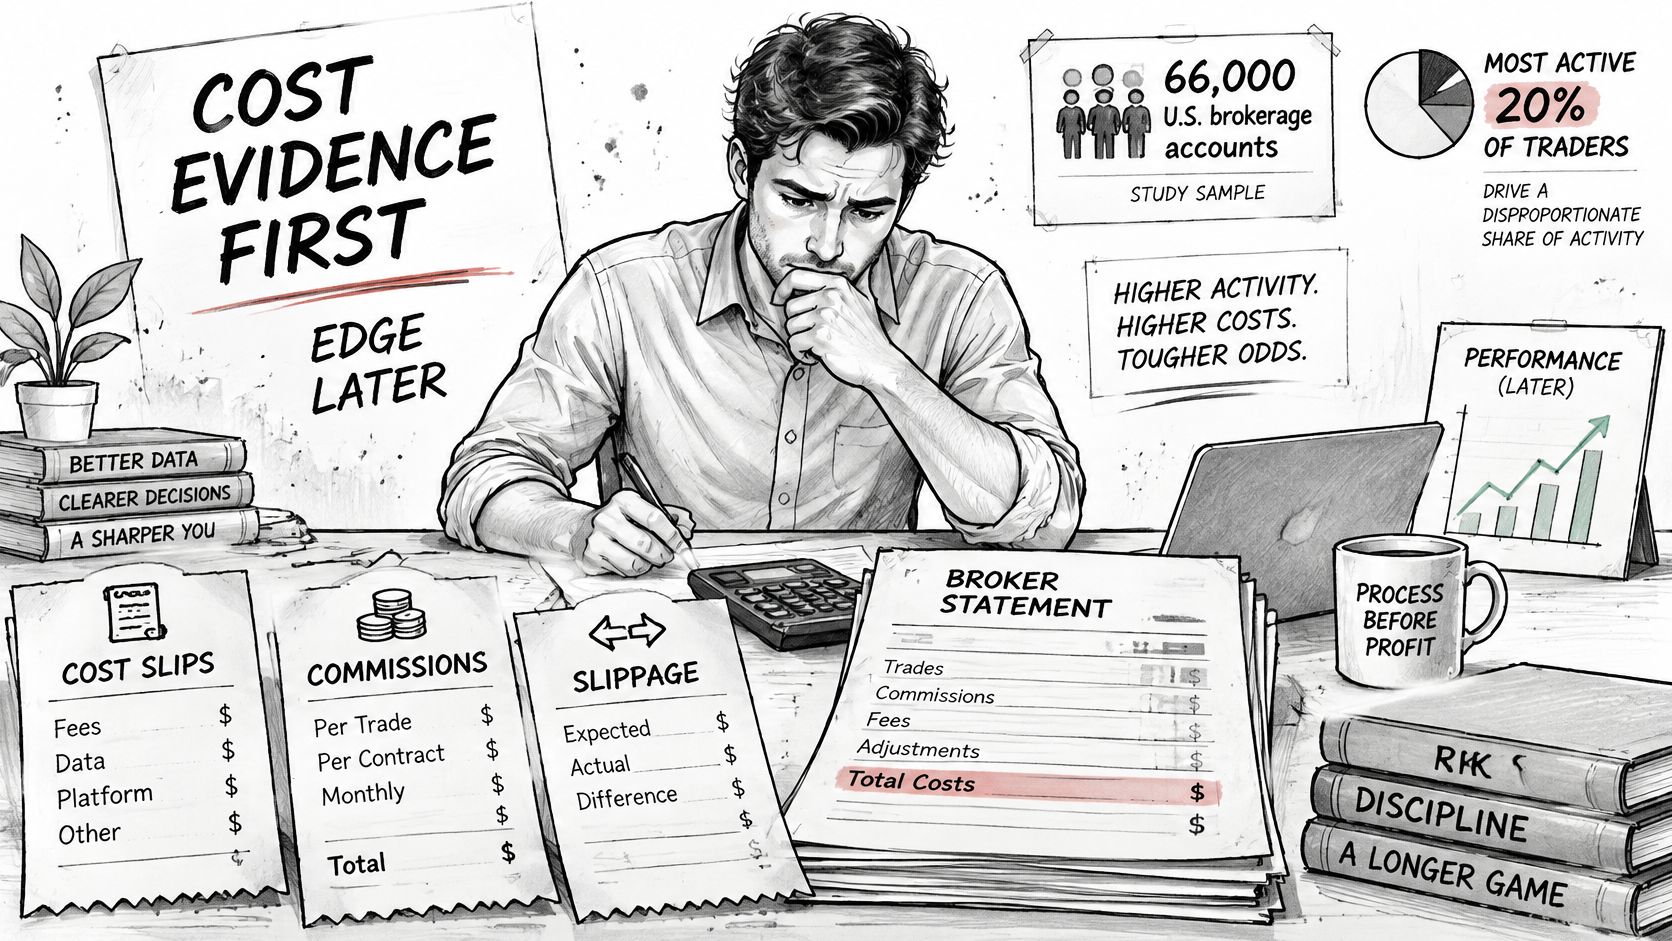
Costs deserve attention before any simulated profit becomes evidence of edge. As summarized by Cabot Wealth, Barber and Odean examined more than 66,000 U.S. brokerage accounts and found that the most active 20% of individual traders underperformed the market by approximately 6% to 7% per year after costs.
That finding doesn't establish whether a particular Pine Script strategy works. It establishes why activity and confidence aren't substitutes for a net-return calculation.
Use broker statements and execution records to identify the costs your simulation must represent.
| Scenario | Cost assumption | What it tests | Pass rule |
|---|---|---|---|
| Platform default | No commission or slippage modeled unless configured | Unadjusted baseline | Report it; don't rely on it alone |
| Commissions and spreads | Broker commission schedule plus applicable spread | Net rather than gross performance | Positive expectancy after costs |
| Slippage range | Several fixed-tick settings | Sensitivity of frequent trades and small edges | Retains its benchmark advantage |
| Delayed alert | Enter on the following bar | Price drift between signal and execution | Expectancy remains positive |
| Gap or wide spread | Stress fill at the adverse bar extreme | Vulnerable stop and exit assumptions | Drawdown remains tolerable |
Make the comparison economically fair
Read the scenarios in order. First preserve the baseline, then add ordinary trading friction, then challenge the assumptions about timing and adverse prices.
Don't count the same friction twice. If your execution-price adjustment already includes the spread, don't deduct the entire spread again as a separate fee. Include financing or borrowing charges where the instrument and holding period incur them.
Compare CAGR, net expectancy per trade, turnover, and maximum drawdown against buy-and-hold or a relevant index over identical dates. Use compatible capital assumptions and consistent dividend treatment. Otherwise, you might be comparing a fully invested passive portfolio with a strategy that uses different borrowing or leaves substantial cash idle.
The adverse-bar scenario is a stress boundary, not a prediction of the fill you'll receive. Record it separately from your ordinary cost estimate.
For a strategy claiming superior returns, positive simulated profit isn't sufficient when a simpler benchmark earns more after costs. A lower-return strategy may still serve a drawdown-reduction objective, but that objective must be specified before reviewing the results.
How to Stress-Test a Backtest Step by Step
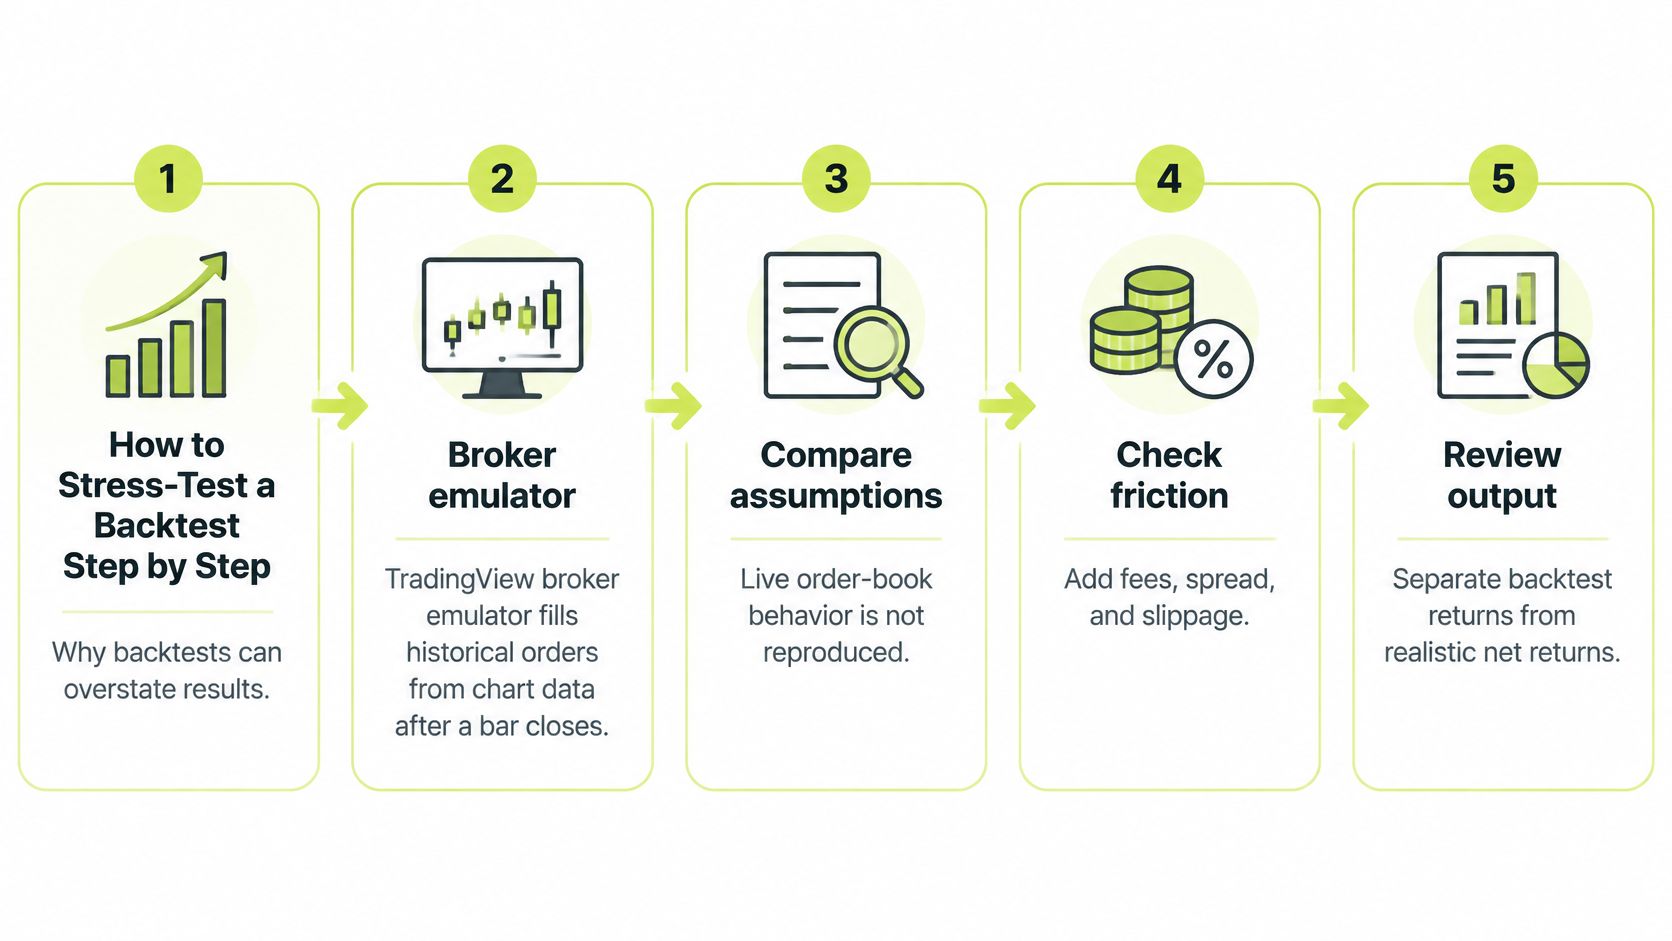
TradingView's broker-emulator documentation explains that historical fills are simulated from chart data rather than live order-book execution; orders commonly fill after a bar closes, while slippage defaults to zero and commissions are absent unless configured. Frequent trading and small expected edges therefore deserve particular scrutiny.
The workflow separates a reproducible simulation from an executable strategy.
Preserve the experiment before judging it
Freeze the specification. Save the Pine Script version, symbol, timeframe, session, sizing, entries, and exits. Later edits require a new validation record.
Log the search. Maintain a worksheet of every parameter set, market, timeframe, and rule variant evaluated. Include failed and abandoned runs.
Separate development from validation. Split history chronologically into a tuning interval and an untouched evaluation interval. Prevent positions or indicator calculations from accidentally importing future information across the boundary.
Apply execution assumptions. Configure your broker's commission schedule and a range of fixed-tick slippage settings. Run the cost scenarios, including timing and adverse-price cases, with assumptions saved beside each result.
Perturb the inputs. Move lookbacks, thresholds, and exit settings to neighboring values. Report the distribution of outcomes rather than presenting only the strongest curve.
Inspect performance across conditions. Compare CAGR, Sharpe or Sortino ratio, maximum drawdown, expectancy, exposure, and turnover. Check whether aggregate profit conceals a period in which the strategy became unusable.
Forward-test the alert path. Capture events in test mode, inspect payloads and timing, and reconcile them with intended trades. Where execution testing is appropriate, distinguish paper or actual fills from alerts that were merely received.
Measure selection failure
Bailey, Borwein, López de Prado, and Zhu's probability of backtest overfitting paper proposes evaluating how often the best in-sample configuration underperforms the median out-of-sample result, using combinatorially symmetric cross-validation.
A chronological holdout alone isn't that full procedure. It's a practical starting point, while the formal framework addresses the broader problem of selecting winners from many candidates.
Our guide to backtested trading strategies can help organize the testing workflow. Keep each run's configuration and trade export so another person can reconstruct your comparison.
The pass condition is economic viability across the specified cost range, tolerable drawdown, and forward behavior consistent with the frozen rules. A strategy that survives only the most favorable execution assumption isn't ready for automation.
Where Automated and AI-Built Ideas Break Down
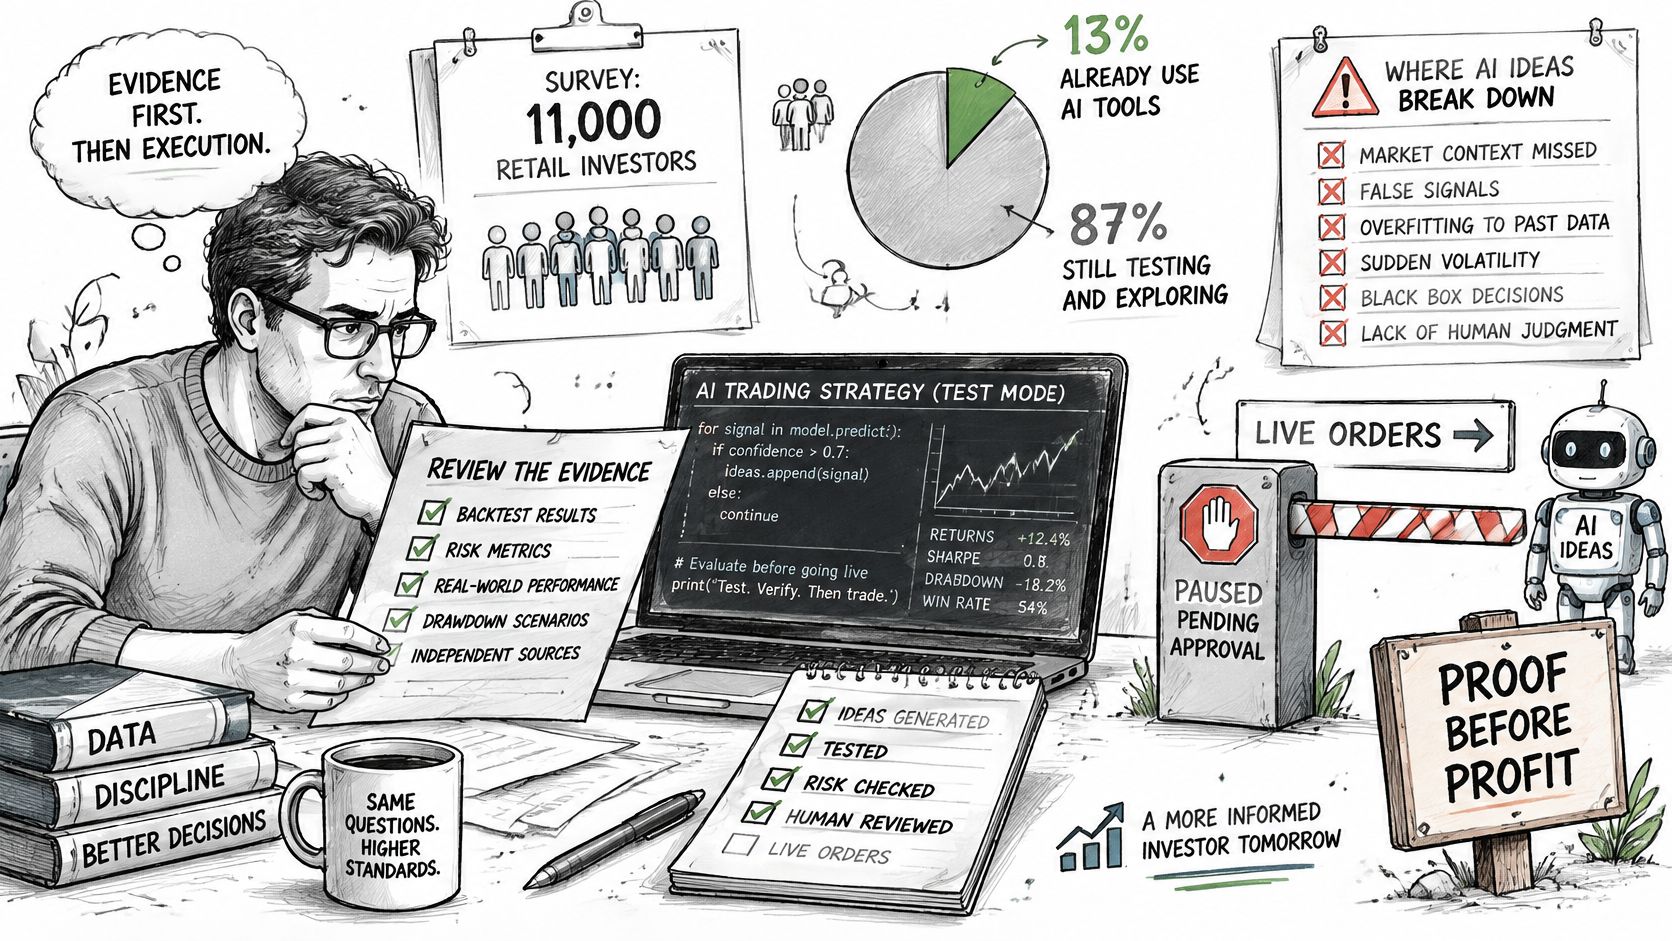
An AI-assisted script shouldn't control real orders just because it compiles and produces a convincing explanation. Before enabling execution, require evidence of code correctness, statistical strength, and operational safety.
Reuters reported an eToro survey of 11,000 retail investors in which 13% already used AI tools such as ChatGPT or Gemini for investment decisions, while about half said they would use them. Adoption measures interest, not reliability.
Review the strategy's logic separately from the AI's explanation of it.
Test distinct layers of trust
Code correctness comes first. Inspect future-data leakage, higher-timeframe requests, repainting behavior, and the exact condition that emits an alert. Require explicit position sizes and exit rules, including what happens when an entry or exit fills only partially.
Statistical strength comes next. Require the frozen specification and its validation artifacts, not an AI-generated summary claiming that the strategy is sound. Check that the script being automated is the version that produced those artifacts.
Operational safety requires event-level inspection. Examine the instrument, side, quantity, event identity, and timestamps in each payload. Exercise duplicate delivery, broker rejection, pause, and recovery cases before granting order permissions.
For the execution layer, retain evidence that answers these questions:
- Signal identity: Which strategy event initiated the action?
- Order state: Was an order submitted, rejected, cancelled, or filled?
- Position state: Does the broker position match the strategy's intended exposure?
- Recovery behavior: What happens after interruption or manual intervention?
The accompanying video can sit alongside that review, but an explanation doesn't replace your own event records.
Keep receipt and execution separate
Our default test mode accepts and logs alerts without sending them to the broker. Every alert carries an event ID, and the same alert never trades twice.
Those controls address routing behavior, not strategy quality. A logged alert doesn't demonstrate a fill, favorable execution, or profitability.
Users must continue watching their automations because alerts can arrive late, twice, or not at all; markets move; and brokers reject orders. The evidence that earns trust is a reconcilable trail from strategy event to resulting position, including exceptions.
Choose a Source Only After a Live-Readiness Test
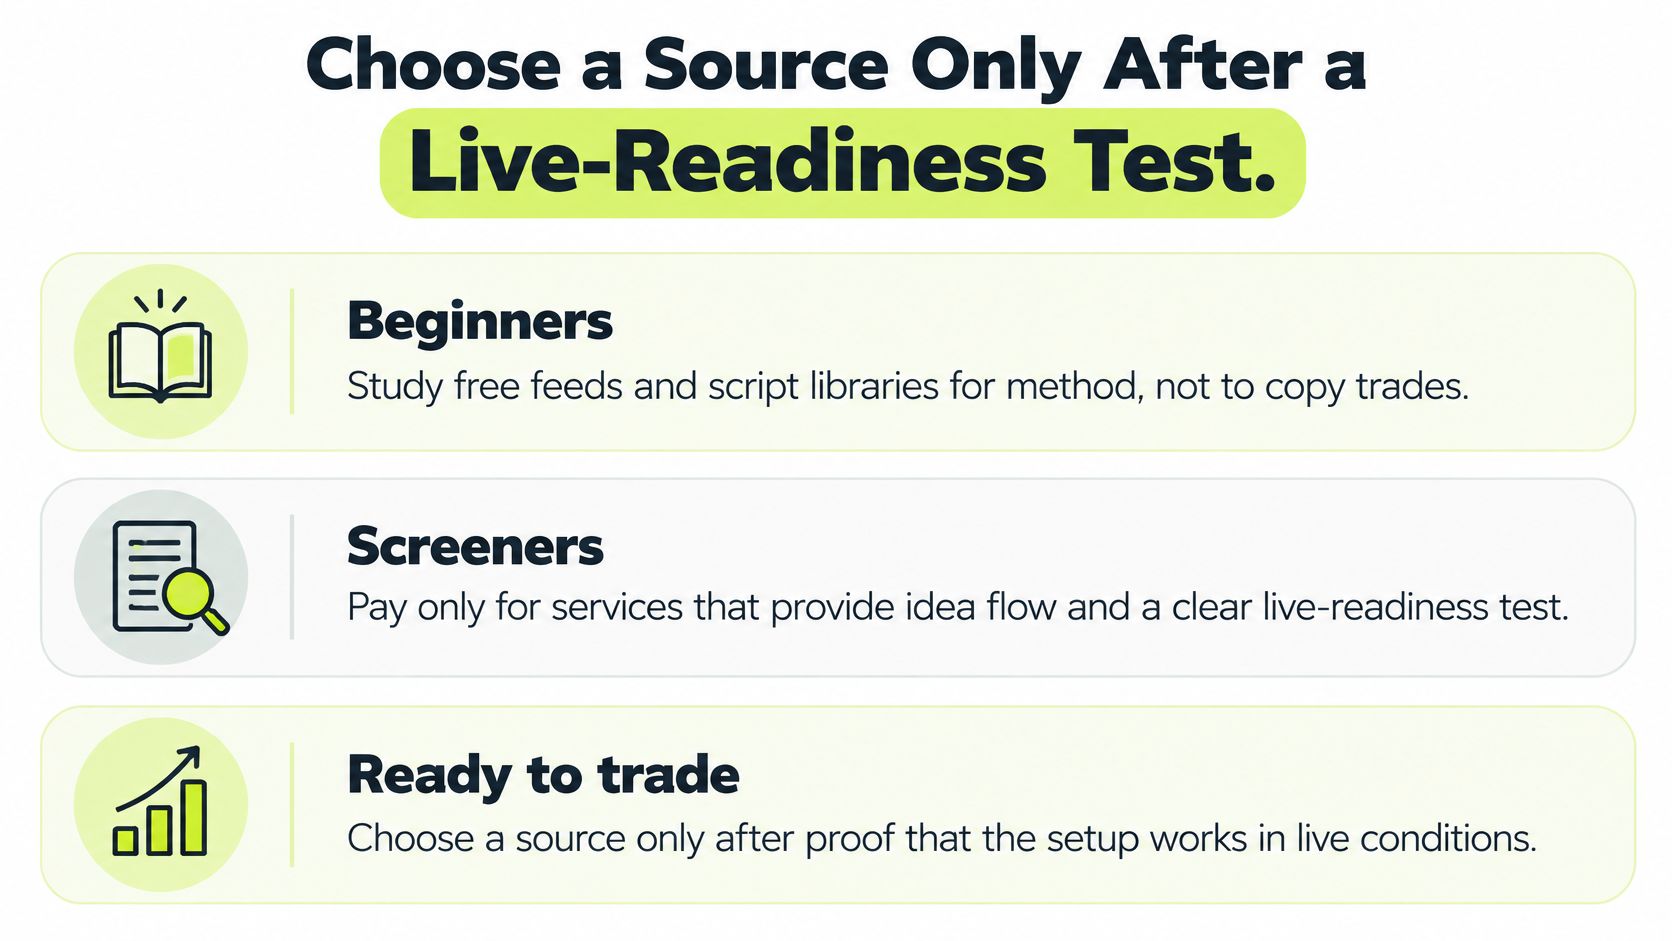
Choose the source according to the work you're prepared to verify, not the return you'd like to receive.
- Beginners: Study free feeds and inspectable scripts for methods, not trades to copy.
- Screeners: Pay for idea flow only when performance claims come with independently audited records whose scope you can inspect.
- Automation users: Start with your own validated rule and a test-mode event record.
- Experienced backtesters: Preserve the full experiment history, including discarded variants.
Use the readiness summary to separate learning from permission to trade.
Make a documented go-or-stop decision
Choose an idea, complete the scorecard, run the execution scenarios, and define a forward-testing period before collecting results. Specify acceptable signal discrepancies, costs, and drawdown in advance.
If the forward record supports those limits, any move to live trading should begin with small exposure and continued logging. Walk away when net results fail the stated objective or the records can't explain the positions you hold.
For TradingView users executing on Robinhood, Pineflows offers a test-first route. Setup takes one sitting; live mode requires a verified real alert, a Robinhood connection, and an active trial or plan. Review the test-mode alert log before switching.
Our monthly plan is Pineflows Pilot, priced at the amount shown at checkout, billed in advance through Stripe, and renewed automatically until cancelled. The 7-day free trial starts after onboarding finishes, with no card needed.
Users remain responsible for TradingView, Robinhood, and Claude terms, including Robinhood's Agentic Trading rules, and applicable local law.
Final boundary: A backtest isn't a forecast. This article and our software aren't investment advice, and trading involves risk of loss.
Pineflows turns configured TradingView strategy alerts into Robinhood market orders, with test-mode logs and event-level status visibility. Visit Pineflows to inspect your strategy's alert path before deciding whether to enable live execution.