October 30, 2026 · 14 min read · Pineflows team
How to Backtest Trading Strategy: A Step-by-Step Guide
Learn how to backtest trading strategy in TradingView: lock your rules, add realistic costs, run walk-forward tests and check execution before going live.
The most popular advice on how to backtest trading strategy is still "tweak the settings until the equity curve looks smooth, add a commission, and trust the result." That advice fails in two places. The curve you admire was often built by trying many rules on the same prices, so it can describe noise rather than a repeatable edge. And a Strategy Tester fill is not a broker fill. Alert timing, duplicate events, rejected orders, and partial fills sit between the signal and the account, and almost nobody tests that path.
A careful test locks the rules first, splits the history before you look at results, and treats every strong curve as a hypothesis. Then it asks a harder question. Would each historical signal have produced exactly one valid, risk-consistent order under realistic delivery conditions?
Table of Contents
- Lock the Rules and Split Your Data
- Write the Pine Script Strategy Correctly
- How to Run the Backtest in TradingView
- Stress Test Costs Before Trusting the Edge
- Read the Metrics That Actually Matter
- Check for Overfitting With Walk-Forward Testing
- Replay the Execution Path Before Going Live
- Decide Whether to Go Live or Keep Testing
Lock the Rules and Split Your Data
A strategy's rules should be fixed before you inspect its results. If you change inputs because the equity curve looks weak, you stop testing a hypothesis and start searching for one that looks good.
Write the strategy down in plain language first:
- Name the market and bar interval. Choose one liquid instrument, such as an index ETF or futures contract, and one timeframe. Keep that choice fixed rather than expanding the universe after seeing which symbol performed best.
- State the entry, exit, and stop rules. Check that the Pine Script matches each sentence. If a rule only occurs to you after looking at the results, it was not part of the original test.
- Freeze position size and risk. Keep both constant throughout the test. For example, size the position at 10% of equity while setting a 1% maximum loss per trade. Position size and maximum loss are different controls: the first sets the trade's scale; the second limits the planned loss.
- Split the history in calendar order. Use development, validation, and untouched out-of-sample periods. Do not shuffle bars. Financial observations overlap in time, so random splits can let information from later prices leak into earlier decisions.
- Keep a variant log. Record every indicator setting, parameter, and market you try, along with the date. For example:
2025-03-02 | EMA cross 21/55 | SPY daily | net CAGR 6.1% | max drawdown 14%. Each row is another trial, and the full list matters when judging the best result.
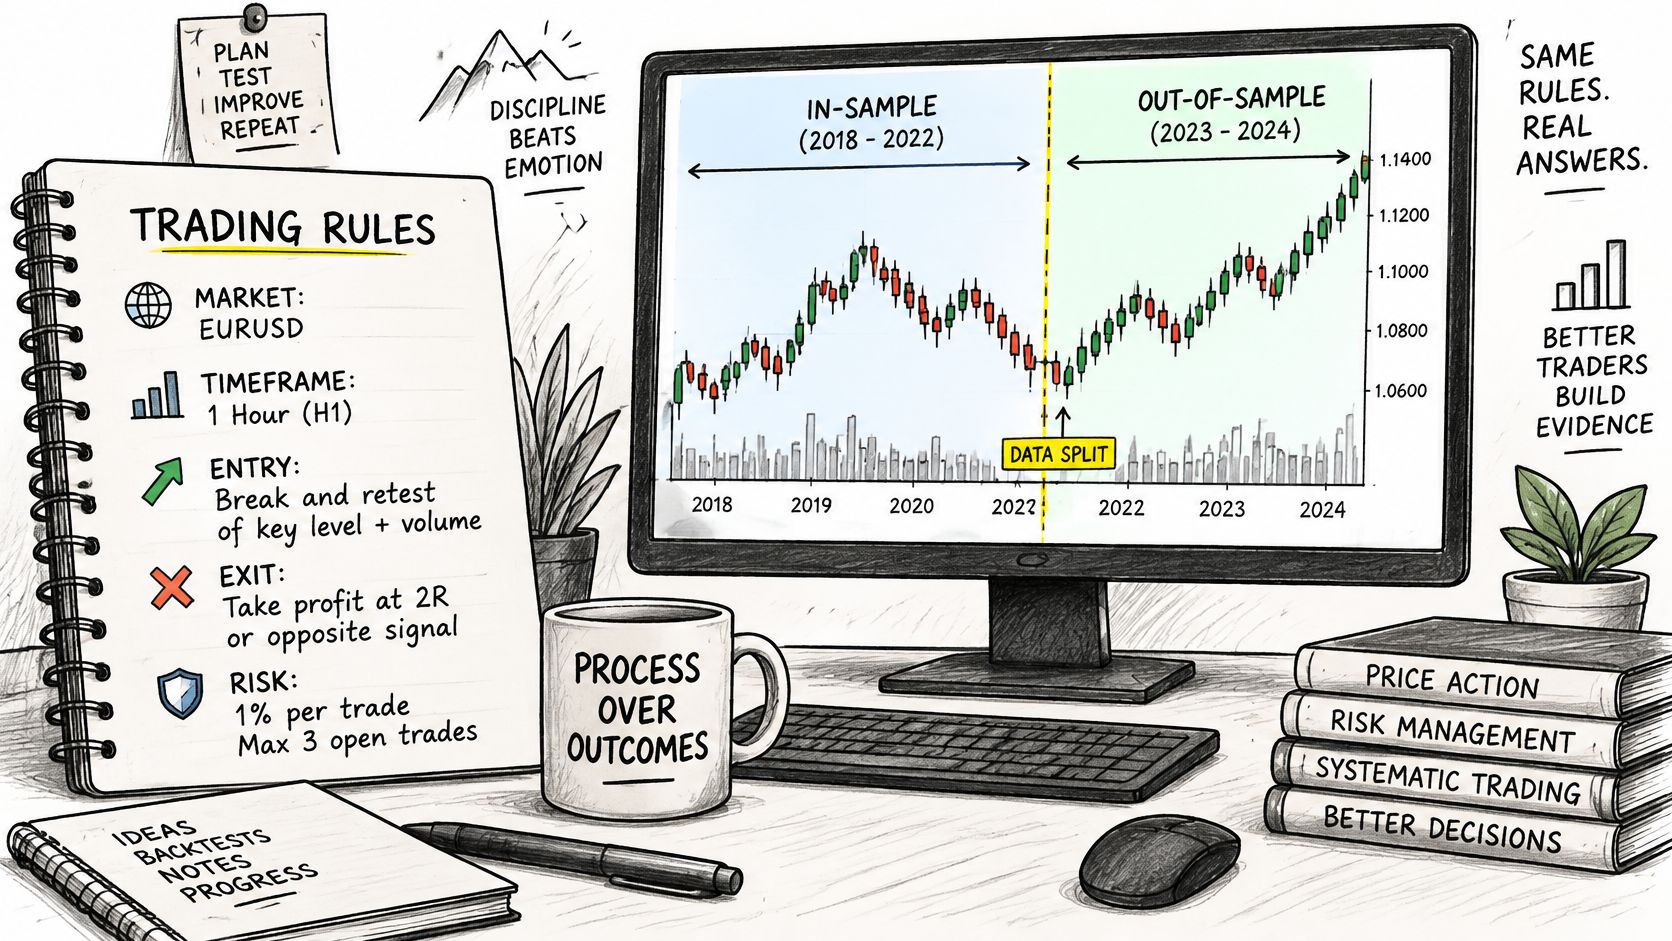
An Oxford Academic review of backtest overfitting explains that testing many model variations against limited data can make one appear optimal even when it performs poorly on unseen data. The review also notes that three or more independent trials raise the chance of seeing at least one result that looks significant at the conventional 5% level above 5%. That means a nominal 95% confidence standard does not account for the search across multiple versions. Save the original Pine Script, parameters, date range, and assumptions before optimizing, then evaluate the frozen version on dates it has not seen.
| Period | Share of history | Purpose | Rule |
|---|---|---|---|
| In-sample development | 60% | Build and tune rules | The only period you may optimize on |
| Validation | 20% | Compare a few final variants | Pick one winner and do not retune |
| Out-of-sample | 20% | Final check | Open once, with no changes afterward |
For ten years of daily bars on one ETF, a calendar split might use 2016 to 2021 for development, 2022 to 2023 for validation, and 2024 to 2025 as the untouched final period. Change rules during development, compare only a short list during validation, then freeze one configuration. Open the last window once. If you change the strategy after seeing those results, that period is no longer out of sample.
If you can't state the rules without looking at the results, you aren't ready to test.
Write the Pine Script Strategy Correctly
The Strategy Tester only measures what the script does. A mismatch between your written rules and the code is a silent change of strategy. Work through this checklist before you run anything, and if you're still learning the language, this TradingView Pine Script walkthrough is a useful companion while you map each rule to a line.
Put the assumptions in the header. Declare strategy() with initial_capital, default_qty_type, default_qty_value, commission_type, commission_value, and slippage. Settings that live only in a dialog can drift between runs. Settings in the code travel with the result.
Fill on the next confirmed bar. Set process_orders_on_close to false and calc_on_every_tick to false so orders wait for the next bar and the script evaluates once per bar close. Acting on an unconfirmed bar is how a backtest sees a price the market hadn't printed yet.
Match every exit to one call. Use strategy.entry for entries and strategy.exit for exits, and pass an explicit stop and limit. If the written rule says "exit at a 2% stop or a 20-bar low, whichever hits first," that belongs in one strategy.exit with both conditions. A second close condition written later can fire on a different bar and invent a trade your rule never described.
Stop the script from seeing the future
Confirm the bar before you alert. Gate alert conditions with barstate.isconfirmed. Don't act on the current bar's unconfirmed values.
Keep higher-timeframe data honest. In request.security, leave barmerge.lookahead_off and fetch a higher timeframe only after that bar has closed.
Delete anything that reads ahead. Remove plots and variables that reference future bars, then compare the script to the written list one line at a time.
When you adapt a public script, keep a copy of the original and note each edit. A quiet change to a default quantity or commission can rewrite the equity curve without changing the chart you see.
How to Run the Backtest in TradingView
A clean Strategy Tester run proves the script behaves as written on the dates you chose. It doesn't prove the idea has an edge. Run it like a lab procedure.
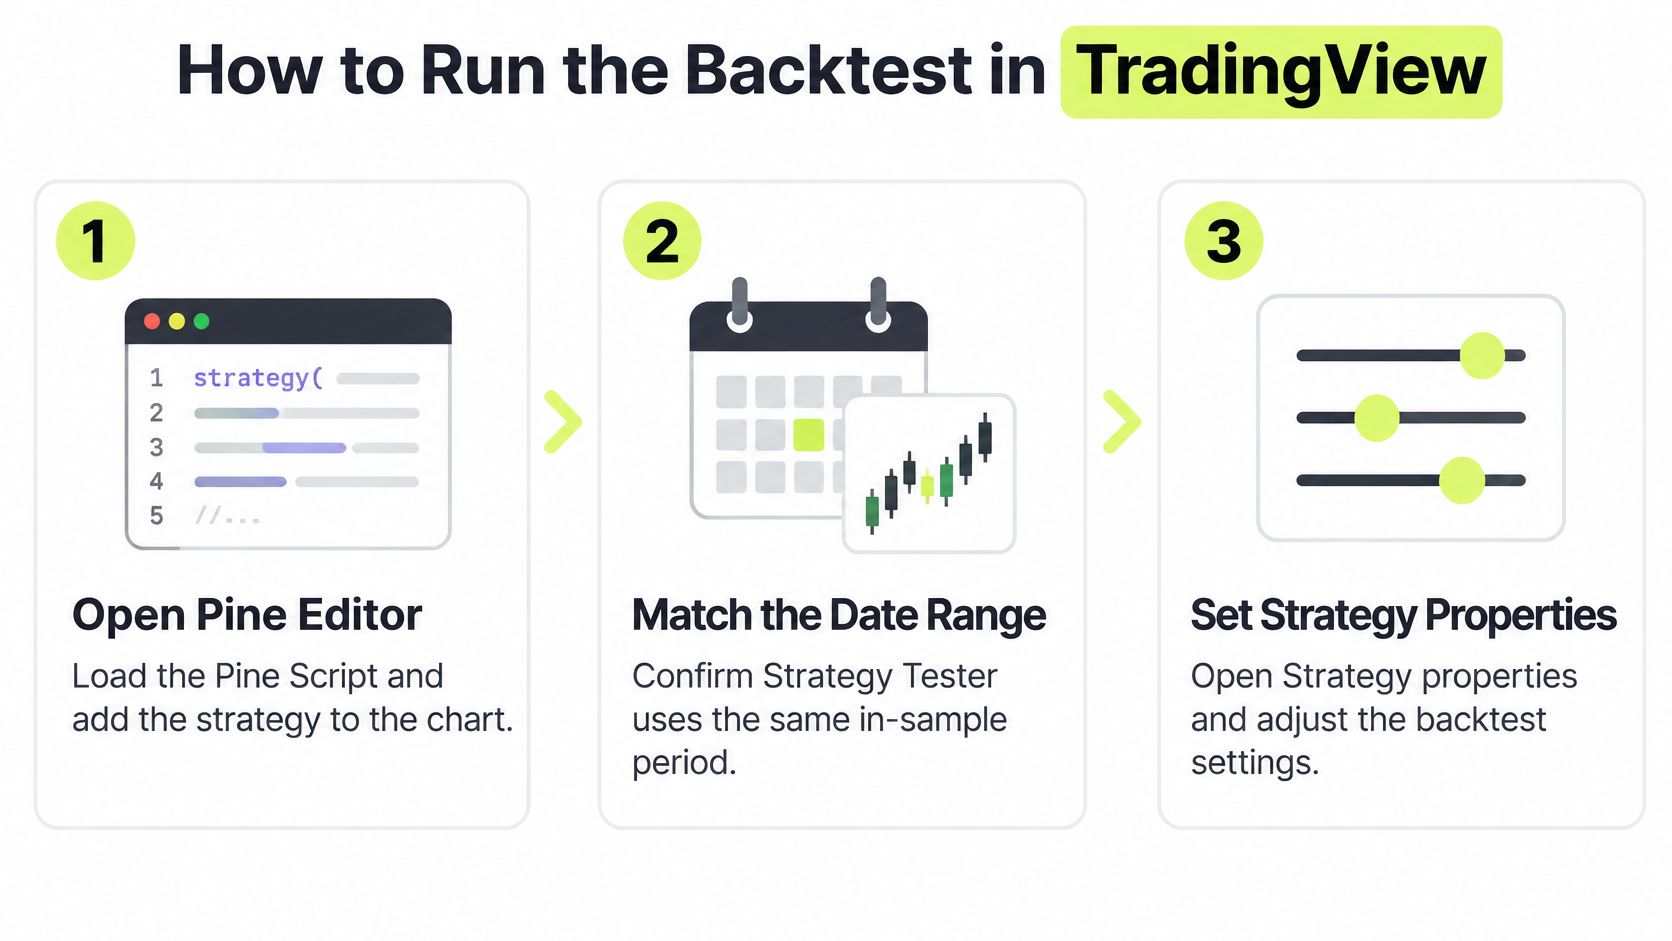
- Load the script on the development window. Open the Pine Script in the Pine Editor, add the strategy to the chart, and confirm the Strategy Tester date range matches your in-sample period only. If the tester includes the reserved years, you've already spent the data you meant to keep clean.
- Set capital, size, and commission in Strategy properties. Use the same initial capital and order size you froze in the rule sheet, and pick the commission type you'll stress later. A property you leave at the platform default is an assumption you didn't choose.
- Stay on a standard chart. TradingView's strategy properties guidance warns that non-standard charts such as Heikin Ashi and Renko use synthetic prices that can produce unrealistic results. Test on the chart type whose prices a broker could trade.
- Read Overview for the shape, not the verdict. Note net profit, the number of trades, and maximum drawdown. A huge net profit on a handful of trades is a story about a few bars, not a sample.
- Audit at least ten trades in List of Trades. For each one, confirm the entry falls on the bar your rule names, at a price the chart could have offered. If the fill sits inside a bar the market never traded through, the script is cheating.
- Expect the fill after the signal bar. Historical emulation generally places the order on a later bar than the one that generated the signal. If your manual check shows a fill on the signal bar's close, the timing doesn't match how the tester is supposed to work.
- Archive the run as a bundle. Export the trade list and save the Pine Script version, the property settings, the date range, and the results in one folder. You can't reproduce a result you can't name.
A clean run only proves the script did what you wrote. It doesn't prove the idea will make money.
Stress Test Costs Before Trusting the Edge
Gross signals can be economically empty once you pay to trade them. Build three simulations of the same signals: optimistic, base, and stressed. Change only the friction.
Apply commission on both the entry and the exit. Model slippage as a fixed number of ticks, and widen the spread in the stressed case, because a simple tick adjustment doesn't recreate changing spreads, latency, or market impact. In the stressed run, add a one-bar delay so the order takes the next executable price rather than the signal bar's close.
Then raise costs in steps until net return reaches zero. That break-even cost is how fragile the edge is. Estimate annual drag by multiplying trades per year by the round-trip cost, and compare the net result with buy-and-hold over the same dates and the same exposure.
Say a strategy makes 0.3% per trade before costs. A 0.1% round trip plus two ticks of slippage can erase that. Set the tolerance before you open the stressed report. Abandon the idea if stressed net CAGR falls more than 30% below the base case, or if the break-even cost sits below the round trip you pay.
A recent U.S.-market study found that strategy performance degraded as transaction costs increased, and that at a 25-basis-point cost level one strategy's performance became comparable to a passive benchmark. A high win rate does not guarantee durability. A strategy can win often and still lose after costs because average wins are small, turnover is high, or losses arrive in gaps.
| Scenario | Slippage or spread | Fill timing |
|---|---|---|
| Optimistic | 0 ticks, midpoint fill | Signal bar close |
| Base | 1 tick plus broker commission | Next bar open |
| Stressed | 2-3 ticks plus wider spread | Next bar open plus one-bar delay |
Replace the tick counts with your broker's fees and the instrument's typical spread. Keep the three-way structure. One conservative setting isn't a sensitivity test.
Read the Metrics That Actually Matter
No single number can clear a strategy. A defensible test is a sequence of pre-specified experiments, and the report should show several measures together. A paper on backtest statistics argues for judging net CAGR, volatility, maximum drawdown, turnover, profit factor, trade count, exposure, tail loss, and benchmark-relative return, not the Sharpe ratio alone. Selecting the best result from many trials is the trap. The Deflated Sharpe Ratio adjusts for that selection bias and for non-normal returns, and combinatorially symmetric cross-validation estimates the Probability of Backtest Overfitting, the chance the in-sample winner underperforms out of sample.
What each number is for
Net CAGR is the annual return after every cost you modeled. If it's positive only before costs, you don't have a tradable result.
Maximum drawdown is the worst peak-to-trough loss. A 40% drawdown on a strategy you'd abandon at 20% is a failed test, whatever the return says.
Profit factor is gross profit divided by gross loss. Near 1.0 after costs, the wins aren't paying for the losses.
Trade count is how many independent outcomes you have. A few dozen trades can produce almost any curve by chance.
Exposure is the share of time capital is in the market. High exposure with a flat return means you took market risk and got little back.
Tail loss is the size of the worst trades. One trade that erases a year of gains means the average is hiding the risk.
Benchmark-relative return compares you with buy-and-hold on the same dates. Trailing a passive holding of the same instrument isn't an edge.
The same statistical standard treats a strategy as unvalidated if the edge disappears after modest parameter changes, a different market regime, or realistic execution assumptions. For a plain-language picture of what a durable setup looks like before you automate it, see what makes a good trading strategy.
| Metric | What It Tells You | Warning Sign |
|---|---|---|
| Net CAGR | Annual return after all costs | Positive only before costs |
| Maximum drawdown | Worst peak-to-trough loss | Deeper than you would hold through |
| Profit factor | Gross profit divided by gross loss | Close to 1.0 after costs |
| Trade count | How many independent results you have | Too few trades to trust |
| Exposure | Share of time capital is invested | High exposure for a flat return |
| Tail loss | Size of the worst trades | One trade erases a year of gains |
| Benchmark-relative return | Return versus buy-and-hold on the same dates | Trails the passive benchmark |
A high win rate can still lose money when winners are small or losses arrive in gaps. Read the row, not the headline return.
Check for Overfitting With Walk-Forward Testing
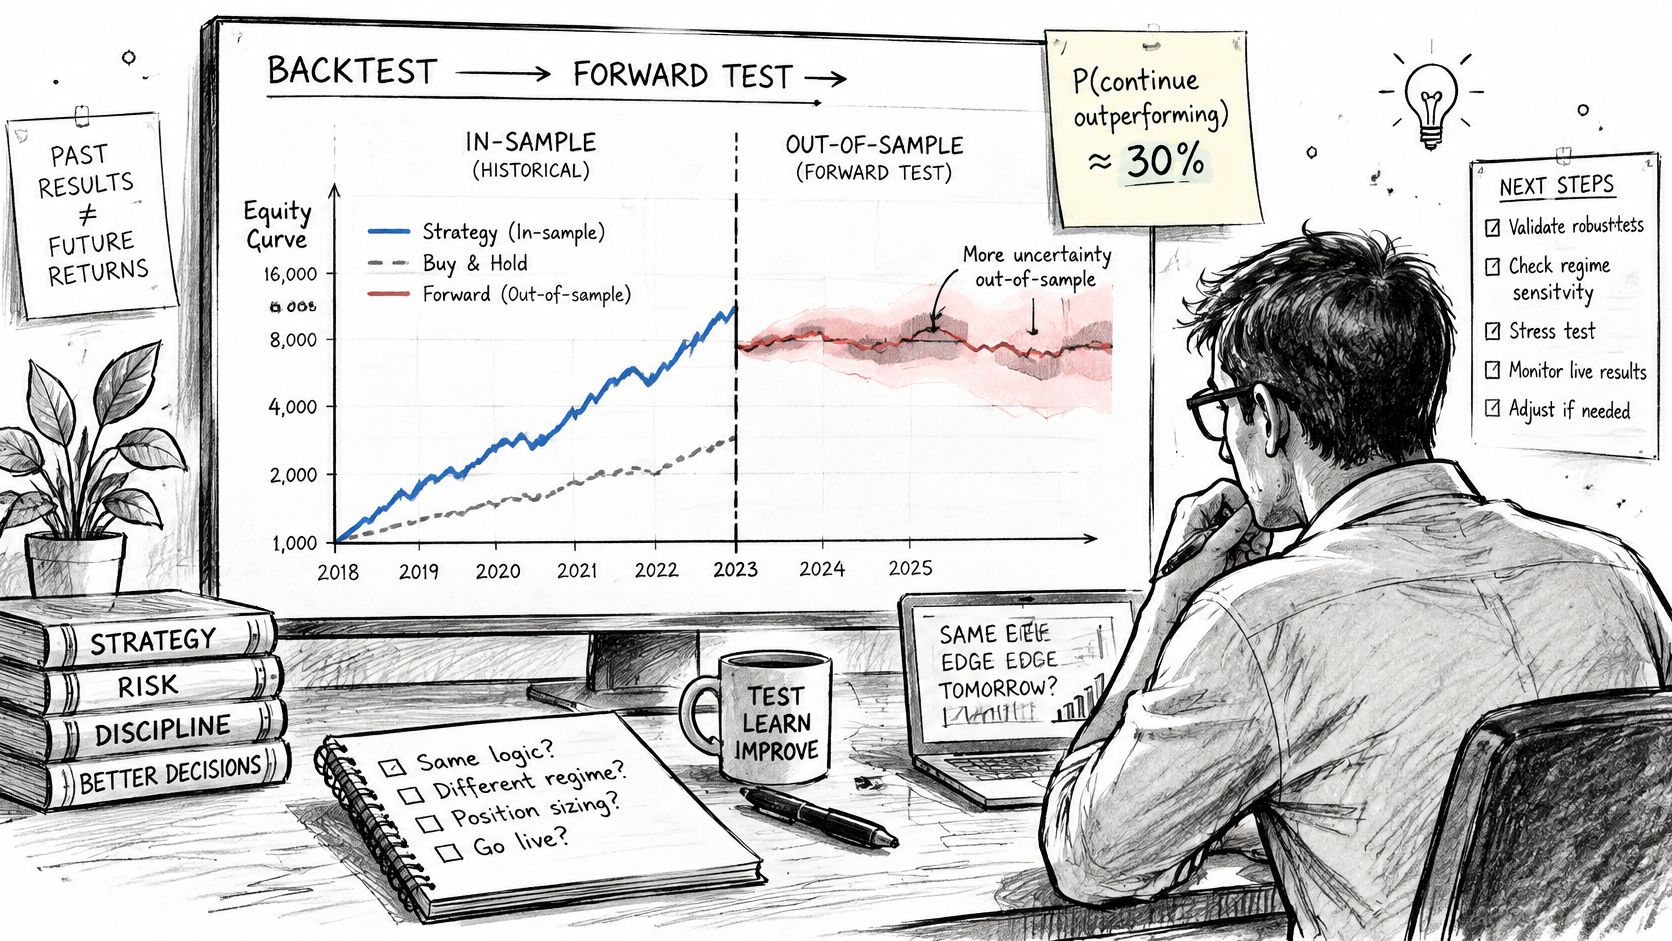
Picking the best in-sample result is a gamble. In a Bayesian study of technical trading strategies, the best in-sample-selected strategy had a 32.8% probability of loss out of sample, and the estimated probability of backtest overfitting was approximately 0.44. Correcting the Sharpe ratio for selection effects reduced it by more than 73%. Optimization can manufacture a handsome statistic. Confidence comes from untouched data, realistic costs, and a check that the rules still behave when you didn't get to choose the window.
A walk-forward you can actually run
Walk-forward testing forces the fit to stay behind the trades.
- Fit on a rolling two-year window. Tune only inside that window.
- Freeze the parameters. Write them down. Don't nudge them because the next window looks different.
- Trade the next six months with no changes. That segment is the result that counts.
- Advance six months and repeat. The old out-of-sample months can join the next fit. They can't be rewritten.
- Stitch the out-of-sample segments into one curve. Compare that curve with the in-sample result. A large gap is overfitting, not bad luck on one quarter.
Then perturb the settings. Move each parameter by 10% to 20% and confirm the edge still shows up. A moving-average crossover that works only at a 37-period length, and fails at 33 and 41, is fitted to noise. A rule that survives a neighborhood of values is harder to dismiss as a single lucky setting.
Report net return, maximum drawdown, volatility, trade count, win rate, profit factor, and a risk-adjusted return across more than one market regime. A strategy that only looks good in a single bull run hasn't been tested. It has been described.
This walk-forward overview is a useful picture of rolling windows if you want the sequence in motion.
Practical rule: Pineflows isn't investment advice, trading involves risk of loss, and a backtest isn't a forecast.
Replay the Execution Path Before Going Live
Most guides stop at entries, exits, and profit factor. They never test the path between a signal and a broker fill. TradingView's strategy documentation states that its broker emulator fills only at chart prices and that historical orders generally execute on the next bar or later, unlike live trading. Commission and slippage can be assumed, but slippage is a fixed tick adjustment, not a model of latency, spread changes, market impact, or liquidity. A strong historical edge can still fail because the routing and state layer is fragile, even when the Pine code is unchanged.
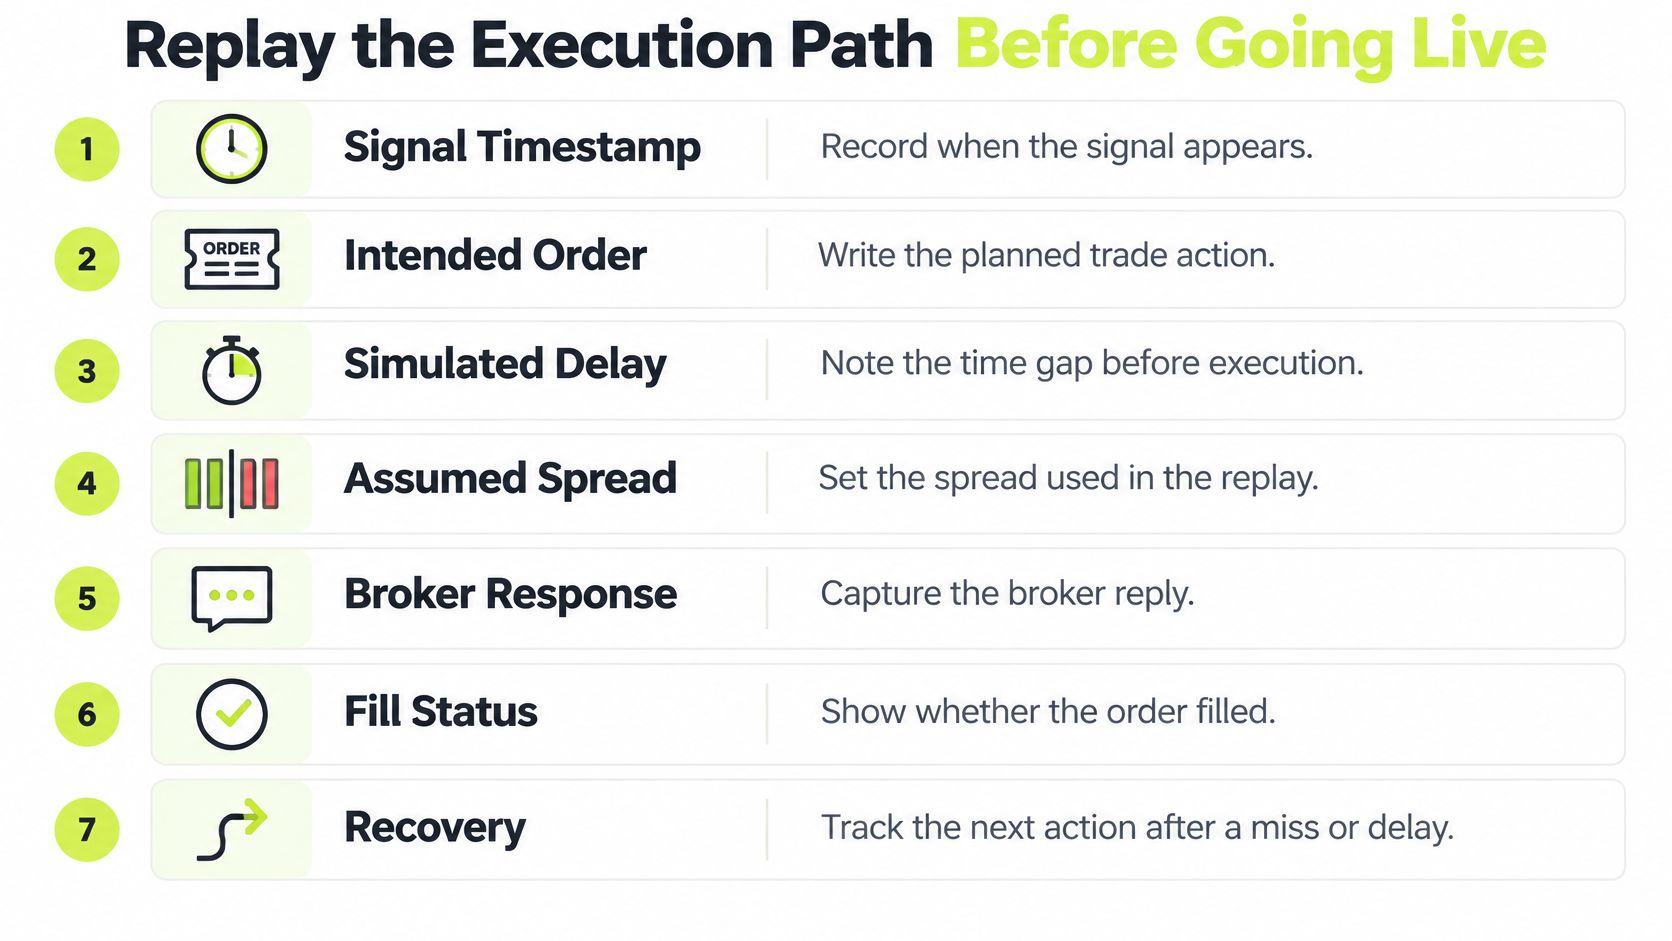
Build an event-level replay for every signal. Record the signal timestamp, the intended order, a simulated delay, the assumed spread, the broker response, the fill status, and the recovery action.
Cases that break automation
Write the handling rule before you see a failure. Then prove it with a log line.
| Case | Expected handling | Evidence in the log |
|---|---|---|
| Alert arrives late | Order skipped if it is past your price tolerance | Signal time versus receipt time |
| Alert arrives twice | Only one order for one event ID | Duplicate flag on the second event |
| Alert never arrives | Missed signal recorded and reviewed, not silently retried | Event with no receipt |
| Insufficient buying power | Order rejected, position unchanged | Broker rejection reason |
| Partial fill on thin instrument | Remaining quantity handled per your rule | Filled quantity versus requested quantity |
| Stop triggered in a gap | Fill recorded at the actual gap price | Fill price versus stop level |
| Signal near session close | Order held or cancelled per rule | Session timestamp and order status |
A test alert sent from TradingView leaves placeholders blank, so it doesn't count as a real fill. Paper trading on the chart is a separate rehearsal of discretion and timing. This guide on how to paper trade in TradingView covers that rehearsal. It still doesn't prove webhook delivery.
Pineflows starts in test mode, where alerts are accepted and logged but never sent to the broker, until you switch to live mode. Open the signal log for each replayed event. If an alert arrives and no order is placed, the log names the reason: paused, duplicate, test mode, plan needed, or Robinhood not connected. Confirm that one event ID produces at most one order before you consider live mode. The question isn't only whether the strategy would have made money. It's whether every signal would have produced exactly one valid order.
Decide Whether to Go Live or Keep Testing
A convincing equity curve is a hypothesis, not a green light. Go live only when the costs, unseen-data results, signal handling, and automation settings all hold up. If one condition fails, keep testing rather than balancing it against a pass elsewhere.
- Costs. The edge survives the stressed scenario within the tolerance you set before reviewing the results.
- Unseen data. Out-of-sample results remain within a gap you can accept. If performance collapses compared with the in-sample curve, revisit the rules instead of searching for new parameters on the same data.
- Signal handling. Each real alert is logged, and duplicate events do not produce duplicate orders. In test mode, alerts are logged but never sent to the broker.
- Reviewed settings. Check every automation input against the Pine Script. A mismatch between the strategy and its alert configuration can lead to unintended orders.
The next sitting
Setup takes one sitting and has four steps: sign in with Google, connect Claude, create one TradingView alert, then review the configuration before going live. Point the alert's webhook to the URL Claude provides. Start in test mode and review the alert log: each received event should appear as a logged alert, not as an order.
Before switching modes, approve the exact configuration and verify what Claude set up. Claude can make mistakes, so check the instrument, sizing, entries, and exits against your strategy. A backtest is not a forecast, and trading involves risk of loss.
Pineflows turns TradingView alerts from Pine Script strategies into Robinhood orders. Its test mode logs alerts without sending them to the broker, letting you review the automation path before enabling live orders. Backtesting means checking both the strategy's historical results and the route from signal to order. When the rules, costs, and alert handling all hold up, you can run the first alert in test mode with Pineflows.