November 6, 2026 · 12 min read · Pineflows team
How to Use Average True Range Trailing Stops
Learn how to calculate average true range trailing stops, choose ATR periods and multipliers, code them in Pine Script, and fix common failures.
You're watching a winning trade give back its gains because your fixed stop was too tight for a noisy day, or too loose for a quiet one. You move it by hand, second guess yourself, and exit either too early or far too late. Average true range trailing stops solve part of that problem by setting distance from recent volatility, then ratcheting the stop as price advances.
That formula is only part of the result. Market regime and execution quality can matter more than whether you pick two or three ATRs. A stop can be well placed on the chart and still fail in a sideways market, through an overnight gap, or after a delayed alert.
Table of Contents
- Calculate the ATR Trailing Stop Step by Step
- ATR Period and Multiplier Settings to Start With
- Coding the Trail in Pine Script
- Reading a Three-ATR Stop on Nvidia
- When ATR Trails Fail and How to Fix Them
- Confirm Your Trail Settings Before Going Live
Calculate the ATR Trailing Stop Step by Step
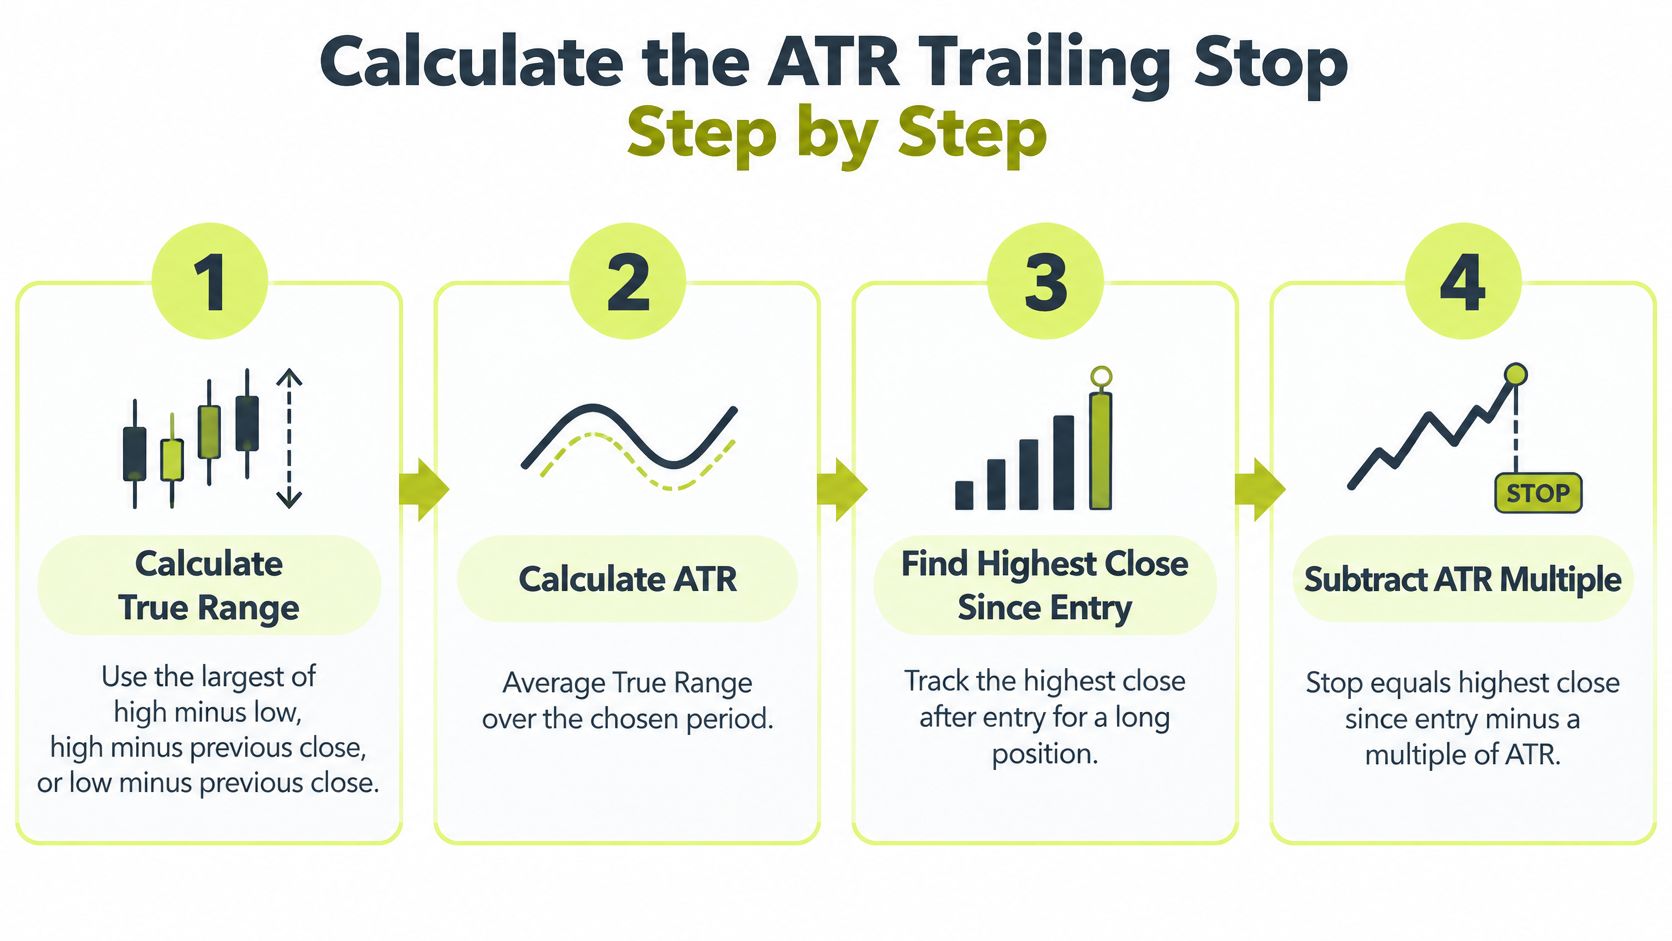
For a long position, the rule is simple. Stop equals highest close since entry minus a multiple of ATR. If you're new to placing exits this way, review how to determine stop loss and take profit levels alongside the arithmetic below.
Build True Range First, Then ATR
- Calculate True Range for each bar. Take the largest of high minus low, the absolute value of high minus previous close, and the absolute value of low minus previous close. Using the previous close matters because it captures gaps that high minus low alone would miss.
- Smooth True Range into ATR. Over 14 periods with Wilder smoothing, each new ATR equals ((prior ATR x 13) + current True Range) divided by 14. The first ATR is a simple average of the first set of True Range values.
- Find the anchor. For a long trade, track the highest close since entry. Don't use the intraday high, since one brief spike shouldn't drag your stop upward and lock in a level price never held at the close.
Place and Ratchet the Stop
- Subtract the distance. Say your highest close is 100.00 and ATR is 2.40. A 3x stop distance is 7.20, so the stop sits at 92.80.
- Ratchet, never lower. Each bar, calculate a candidate stop from the current anchor and ATR. If that candidate is below yesterday's stop, keep yesterday's stop. For a long position, the trail only moves up.
- Exit on a close below the stop. When a bar closes under the trail, the trade ends. You're judging the exit on the same closes you used for the anchor, which keeps the logic consistent.
Check your platform first: Confirm its ATR uses Wilder smoothing before you compare your numbers with any article, indicator, or backtest. Different smoothing gives a different stop from identical prices.
Period choice also changes the result. The 2025 StockCharts ChartSchool reference on ATR Trailing Stops states that ATR Trailing Stops use a default 21-period ATR calculation, so a platform default may not match the 14-period setup you intended.
ATR Period and Multiplier Settings to Start With
Start with 14 periods and a multiplier between 1.5 and 3. That's the range you'll see most often, and it's wide enough to show you how sensitive your own trades are to distance. Don't treat 2 ATR as a portable default that works on every instrument.
| Setup | ATR period | Multiplier | Source or use |
|---|---|---|---|
| Standard starting point | 14 | 1.5 to 3 | Range commonly used in ATR stop-loss studies |
| StockCharts default | 21 | 1.5 to 3 starting range | ChartSchool default ATR period for ATR Trailing Stops |
| Schwab example (Nvidia, 2025) | 14 | 3 | Initial stop of $94.14 on a $115.74 price |
| StockCharts example (XLK, 2024) | 22 | 5 | ATR(22) reported at 3.091 on March 8, 2024 |
The wider end of that table is instructive. A 2024 StockCharts example applying a 5× ATR trailing stop to the Technology SPDR (XLK) reported an ATR(22) value of 3.091 on March 8, 2024. A steadier fund can carry a larger multiple without the same dollar distance you'd get on a volatile single stock.
What the Multiplier Actually Trades Off
A larger multiplier gives price more room. You'll get fewer stop-outs, but you'll also give back more profit before the exit triggers. A smaller multiplier protects gains sooner, yet ordinary noise will end more trades that later recover.
That trade-off is why hunting for a perfect multiple disappoints so many traders. The Fidelity volatility-stop research and trend-following evidence summarized with it covers a study of more than 18,000 trades over 22 years that found changing ATR stop settings produced no material differences in overall results, while looser stops slightly increased winning percentages.
A wider stop can help a trade survive without improving expectancy. Survival and profitability aren't the same measurement.
Pick one period and test two or three multiples on the same chart. Count stop-outs, measure profit giveback from the highest close, and note how often price recovered after your exit. Change one setting at a time, or you won't know which change caused the difference.
Coding the Trail in Pine Script
You can turn the formula into a TradingView strategy without rewriting it for every test. If you're still getting oriented, start with the basics of TradingView Pine Script, then build the trail in this order.
Build the Strategy in Eight Steps
- Declare the script. Open with
//@version=5andstrategy("ATR Trail", overlay=true)so the trail plots on the price chart where you can inspect it. - Add inputs, not hard-coded numbers. Use
atrLen = input.int(14)andmult = input.float(3.0, step=0.1). You'll test settings from the settings panel instead of editing logic and risking a typo. - Compute ATR. Set
atr = ta.atr(atrLen). TradingView's built-in function uses Wilder smoothing, which matches the hand calculation. - Use a simple entry rule. Something like
ta.crossover(close, ta.sma(close, 50))keeps the entry deliberately plain. You're testing the exit, so don't let a complicated entry hide what the trail does. - Reset and update the anchor. On entry, set
highestCloseto the current close. On each later bar in the trade, sethighestClose = math.max(highestClose, close). - Build the candidate stop. Calculate
candidate = highestClose - mult * atr. This is only a proposal for this bar, not yet the active stop. - Ratchet the candidate. Use
trail = na(trail[1]) ? candidate : math.max(trail[1], candidate). Thenacheck handles the first bar, andmath.maxprevents the stop from moving down. Resettrailtonaon each new entry so a prior trade's stop can't carry over. - Exit and plot. Call
strategy.closewhenclose < trail, and plot the trail on every bar. If you can't see it, you can't audit it.
Three Errors That Quietly Break the Logic
- Resetting the anchor every bar: If
highestCloserestarts at each close, you've built a plain ATR stop that follows current price, not a trail anchored to the best close since entry. - Omitting the na check: Without it, the first bar's stop is undefined, and the strategy can skip exits or behave unpredictably at the start of a trade.
- Mixing anchors: Don't track the highest high in one line and the highest close in another. Pick closes for both anchor and exit, or your plotted trail won't match your hand calculation.
Verification step: Pick three bars from a test trade and compare the plotted trail with the stop you calculate by hand. If they disagree, fix the script before you trust any backtest result.
Mirror It for the Short Side
For shorts, track lowestClose with math.min, set candidate = lowestClose + mult * atr, and ratchet with math.min against trail[1] so the stop only moves down. Exit when close > trail. The structure is identical. Only the direction of the ratchet changes.
Reading a Three-ATR Stop on Nvidia
Real numbers make the distance harder to ignore. A 2025 Charles Schwab example reported that Nvidia's 14-day ATR was $7.20, equal to 6.2% of its $115.74 share price in late March 2025, and illustrated a three-ATR trailing stop with an initial stop price of $94.14.
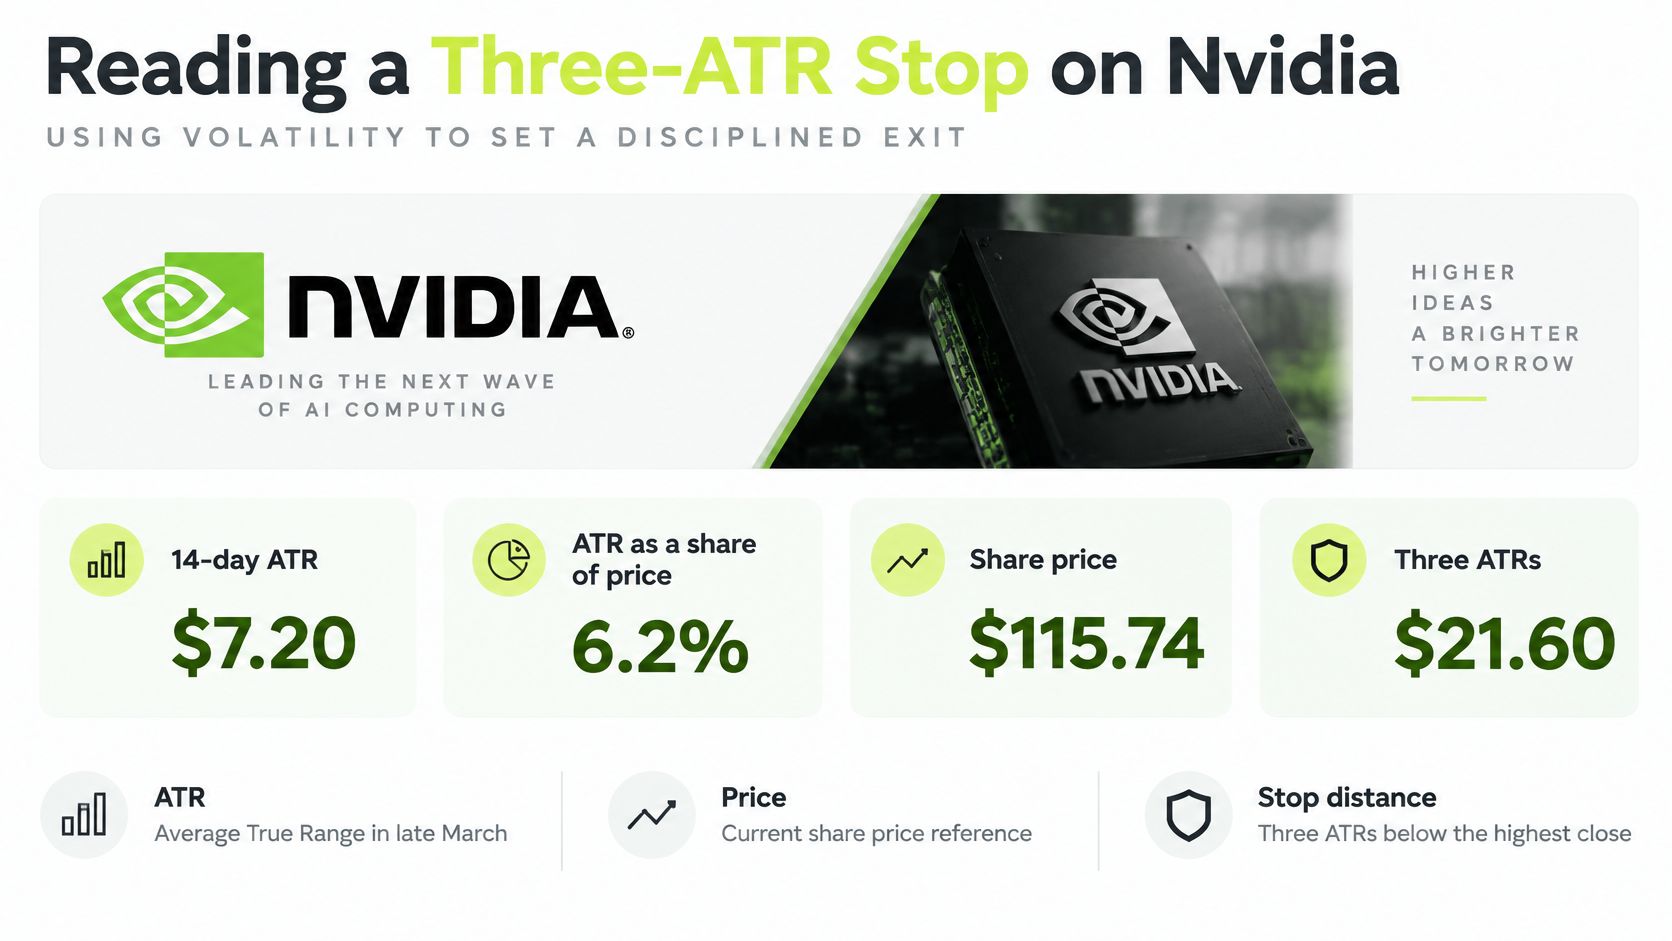
Work it through yourself. Three times $7.20 is $21.60. Subtract that from $115.74 and you get $94.14. That's a stop roughly 18.7% below entry, which sounds alarming until you remember what it represents. Nvidia was routinely moving several dollars a day, so a tighter stop would sit inside normal noise.
Turn Distance Into Position Size
A wide stop doesn't have to mean a large loss. It means a smaller position. With a $1,000 risk budget, divide $1,000 by the $21.60 stop distance and you get 46.3, so you'd buy 46 shares after rounding down. Your planned loss at the stop stays near $1,000 even though the percentage distance is large.
Now trail it. Say the highest close climbs to $130 while ATR holds at $7.20. The stop rises to $130 minus $21.60, which is $108.40. You've moved from risking $21.60 per share to protecting most of the advance, without making a discretionary decision along the way.
| Item | Value |
|---|---|
| Entry price | $115.74 |
| 14-day ATR | $7.20 (6.2% of price) |
| Multiplier | 3 |
| Stop distance | $21.60 |
| Initial stop | $94.14 |
| Share count at $1,000 risk | 46 (rounded down) |
| Stop at $130 highest close | $108.40 |
Compare that with a steadier instrument using a wider multiple. A 5x trail on an ATR of 3.091 gives a distance of about $15.46 per share. The multiplier is larger, yet the dollar distance is smaller, because the underlying volatility is lower. That's the whole point of the method. The instrument sets the scale.
Don't freeze the distance at entry. ATR changes every bar, so recalculate the candidate stop each bar and let the ratchet decide whether it rises. Keep a simple worksheet with entry price, ATR, multiplier, stop distance, and share count for every trade. When an exit surprises you, that worksheet tells you whether the formula moved or you misread it.
When ATR Trails Fail and How to Fix Them
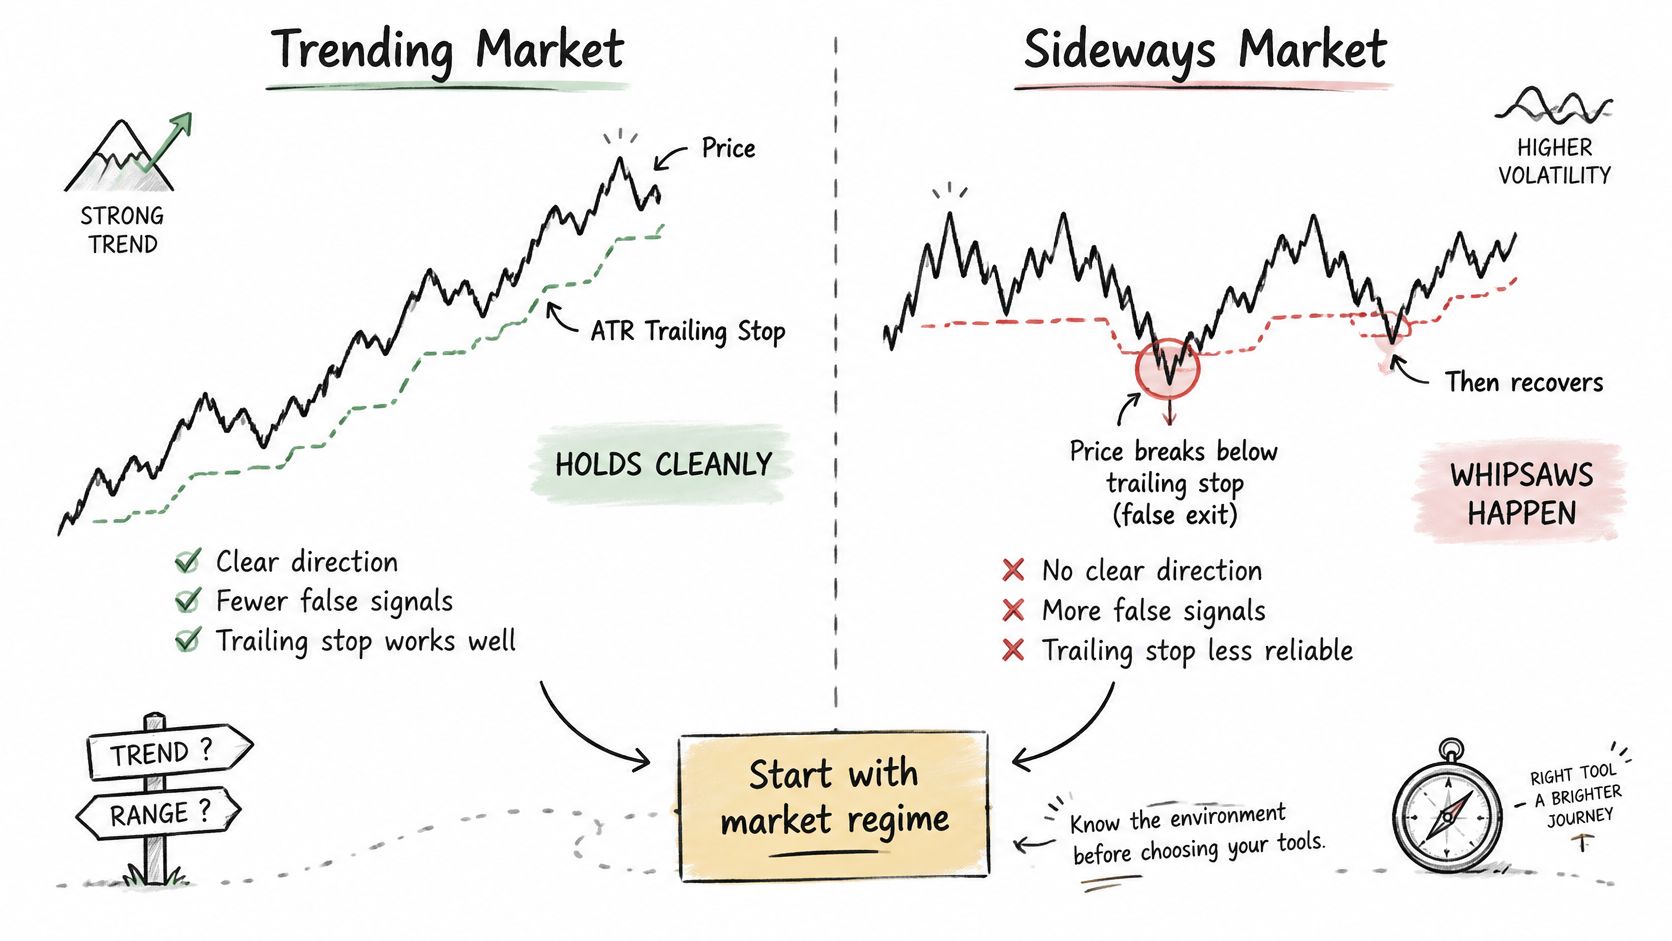
The formula assumes price is going somewhere. In a trending market, pullbacks tend to stay shallower than the advances, so a volatility-based trail can ride the move and exit when the character changes. In a volatile, directionless market, price oscillates around a mean, crosses your trail, recovers, and crosses it again on the next trade. Repeated stop-outs cluster, and no multiplier fixes a market that isn't trending.
The chart below contrasts those two regimes so you can see why the same settings behave differently.
Test by Regime, Not Just by Multiplier
Split your history into trending, range-bound, and volatility-shock segments and run the identical trail on each. Measure stop-out frequency, average adverse excursion, turnover, and profit giveback separately. A setting that looks acceptable across the full history may be earning everything in trends and bleeding steadily in ranges.
That split leads to a better question than which multiple is best. Should your strategy activate, widen, or suspend the trail based on trend strength? A simple trend filter that keeps you out of flat markets often improves results more than moving from 2.5 to 3 ATRs.
ATR Sets Distance, Not Your Fill
Your backtest usually assumes you exit at the stop level. Live trading doesn't promise that. A gap can open far beyond the stop, a fast move can slip a market order, and a delayed alert can send the order after price has already moved. One academic study of ATR stop losses explicitly excludes transaction costs from its evaluation, which limits how confidently its historical results transfer to live trading.
Record the intended stop, alert timestamp, broker acknowledgment, fill timestamp, and fill price for every exit. Then compare theoretical and realized prices. If that gap grows during volatility spikes, your problem isn't the multiplier. It's execution friction, and widening the stop will hide it rather than fix it.
Treat alerts as unreliable by design. You must watch your automations because alerts can arrive late, twice, or not at all, markets move, and brokers reject orders. Our pause control helps you respond without abandoning open positions. Pausing blocks new entries immediately, cancels Pineflows' own open entry orders, and keeps valid exits available.
The walkthrough below shows how these regime and execution checks fit together in practice.
| Symptom | Likely cause | Fix |
|---|---|---|
| Repeated stop-outs in a sideways market | Price oscillates around a mean with no trend | Activate the trail only after a trend filter, or widen the multiplier |
| Exit far below the stop after an overnight gap | Price gaps through the stop and the market order fills at the open | Model gap scenarios and size positions for gap loss, not the stop price |
| Exit fills well after the alert | Alert delivery delay or market-order slippage | Log alert time against fill time and compare realized with intended exit |
| Same exit triggered twice | Duplicate alert delivery | Use event-ID deduplication so one alert triggers at most one order |
| Trail keeps rising but giveback is large | Multiplier too loose for fast reversals | Tighten the multiplier or add a profit-lock rule |
Match each symptom in your log to one row before you change settings. Traders often widen a stop to cure gap losses or tighten it to cure late fills, and both changes miss the actual cause.
Confirm Your Trail Settings Before Going Live
Don't promote a trail from chart to live orders because one backtest looked clean. Backtest across trending, range-bound, and volatility-shock periods, and treat the output as a test. A backtest is not a forecast, and you'll find the mechanics of how to backtest a trading strategy useful for structuring those segments.
Run This Sequence Before You Enable Live Trading
- Freeze one configuration. Choose one ATR period and multiplier, and write down the anchor, ratchet, and exit rule so you can audit it later.
- Stay in test mode for several weeks. Pineflows starts in test mode where alerts are accepted and logged but never sent to the broker, until you switch to live mode.
- Compare every logged exit with your hand calculation. Measure the difference between the intended stop and the price the log implies, and investigate any mismatch before you proceed.
- Rehearse the pause control. Trigger it on a test alert and confirm new entries stop while exits remain available.
- Review the full alert log. You should review the alert log in test mode before switching to live trading, then begin with a small position.
Go or no-go rule: Go live only when logged exits match your calculated stops, duplicate alerts produce no second order, and the stop distance fits your risk budget at your chosen share count.
If any of those checks fail, stay in test mode and fix the cause. This article is education, not investment advice, and trading involves risk of loss. Pineflows is not investment advice, and no backtest result promises a future return.
Test your ATR trail the way you'd trade it by sending TradingView alerts through test mode first, checking each logged exit against your hand-calculated stop, and rehearsing the pause control before any order reaches Robinhood. When those checks pass, visit Pineflows to connect your Pine Script strategy and switch to live mode on your own schedule.