# Keltner Channels vs Bollinger Bands: Which to Use
> Keltner Channels vs Bollinger Bands compared on math, volatility, signals and test results, plus which band fits your market.
Source: https://pineflows.com/blog/keltner-channels-vs-bollinger-bands
Published: 2026-11-03
Updated: 2026-11-03
Tags: keltner channels, bollinger bands, volatility indicators, ATR bands, Keltner vs Bollinger
Two bands can sit **6 price units apart**, look identical on a chart, and still be measuring different things. That's the core of **Keltner Channels vs Bollinger Bands**. One asks how far closes have spread around their average. The other asks how large the typical trading range has been, gaps included.
If you treat them as interchangeable trend or reversal tools, you'll misread both. Treat them as competing definitions of **volatility**, and the choice becomes testable. Which definition matches your market, your session, and the way your bars form?
## Table of Contents
- [Band Math and Width Side by Side](#band-math-and-width-side-by-side)
- [Core Formula Differences at a Glance](#core-formula-differences-at-a-glance)
- [Why the Same Width Behaves Differently](#why-the-same-width-behaves-differently)
- [The 95 Percent Caveat](#the-95-percent-caveat)
- [Where the Two Formulas Came From](#where-the-two-formulas-came-from)
- [A Separate Statistical Tradition](#a-separate-statistical-tradition)
- [One Price Path, Two Band Readings](#one-price-path-two-band-readings)
- [The Gap Bar](#the-gap-bar)
- [When Price Rides an Edge](#when-price-rides-an-edge)
- [Volatility Sensitivity and Gaps by Market](#volatility-sensitivity-and-gaps-by-market)
- [Four Definitions Your Script Must Set](#four-definitions-your-script-must-set)
- [Whether Squeezes and Breakouts Add Signal](#whether-squeezes-and-breakouts-add-signal)
- [What a Large Test Actually Found](#what-a-large-test-actually-found)
- [The Four Cases a Fair Test Needs](#the-four-cases-a-fair-test-needs)
- [Published Test Results and What They Show](#published-test-results-and-what-they-show)
- [Published Head-to-Head Results](#published-head-to-head-results)
- [How to Read the Numbers](#how-to-read-the-numbers)
- [Pick the Band That Matches Your Market and Test It](#pick-the-band-that-matches-your-market-and-test-it)
- [Which Band to Test First by Market](#which-band-to-test-first-by-market)
- [A Test Sequence That Separates Formula From Plumbing](#a-test-sequence-that-separates-formula-from-plumbing)
## Band Math and Width Side by Side
Both bands draw an envelope around a moving average, but the input that sets the distance is different: **Bollinger Bands** use the **standard deviation of closing prices**, while **Keltner Channels** use **Average True Range**. That difference matters more than the multiplier, because the two inputs react to different parts of the bar.
### Core Formula Differences at a Glance
| Element | Bollinger Bands | Keltner Channels |
|---|---|---|
| Centre line | **20-period simple moving average** | **20-period exponential moving average** |
| Width measure | **Standard deviation** of closing prices | **Average True Range (ATR)** |
| Default multiplier | Plus or minus **2 standard deviations** | Plus or minus **2 ATR** |
| Worked width if input equals **1.0** unit | **4 price units** | **4 price units** |
| Worked width if input equals **1.5** units | **6 price units** | **6 price units** |
| Worked width if input equals **2.0** units | **8 price units** | **8 price units** |
| Gap handling | Only indirectly, through the close series | Directly, through **true range** |
| Typical reading | Statistical dispersion around an average | Average trading range per bar |
A common Bollinger default is a **20-period moving average plus or minus 2 standard deviations**, so the full envelope spans **4 standard deviations**. If that standard deviation is **1.5 price units**, the envelope spans **6 price units**. A **20-period EMA** with a **2-ATR multiplier** and **ATR of 1.5** puts each band **3 units** from the center, also **6 units** in total.
The scaling stays linear. At an input of **1.0**, both defaults span **4 units**. At **2.0**, both span **8 units**. Matching width at one moment still says little about the next bar, because standard deviation updates when closes spread out, while ATR updates when the high-low range or gap against the prior close expands.
### Why the Same Width Behaves Differently
A **simple average** weights each close in its window equally, so it usually reacts more slowly than an **exponential average** that gives recent closes more weight. Even when the envelopes have equal width, their centers can sit in different places and drift at different speeds. A break above one center is therefore a different event from a break above the other.
> Two bands with identical width can still give opposite breakout readings if their center lines sit in different places.
**Standard deviation** expands when closes move away from their mean, and one unusually distant close can widen Bollinger Bands quickly. **ATR** responds to bar magnitude and can rise after a gap even if the bar closes near where it opened. This is why the pair work better as competing volatility estimates than as interchangeable breakout lines: one summarizes close-to-close dispersion, the other summarizes range pressure including gaps.
### The 95 Percent Caveat
Under a normal-distribution assumption, about **95%** of observations lie within plus or minus **2 standard deviations**. Financial returns frequently show **fat tails**, **volatility clustering**, and **serial dependence**, so the share of prices inside Bollinger Bands will not always equal **95%**. Treat a band touch as a distance reading, then test the actual distribution on your instrument and timeframe before assigning it a probability.
Neither formula predicts direction by itself. A close outside either envelope says price is far from a center relative to the chosen volatility measure. A squeeze says current width is low relative to that band's own history. Before crediting either pattern, compare it with a volatility-only benchmark: ask whether the signal beats a simple rule that flags an unusually low standard deviation or ATR and waits for expansion, without using a band touch at all.
- **Check the center line first:** Confirm whether your platform uses a simple or exponential average for each indicator.
- **Check the width input next:** Look for **standard deviation**, **ATR period**, and the multiplier applied.
- **Check the price source last:** Close-only calculations and range-based calculations won't respond identically to gaps.
Defaults vary by platform, and some Keltner implementations also let you change ATR smoothing as well as EMA length. Confirm which center line and volatility measure your chart uses before comparing signals; otherwise the debate is about labels, not formulas.
## Where the Two Formulas Came From
Chester W. Keltner described the original method in his **1960** book **How to Make Money in Commodities**, according to [EasyTradeWeb's Keltner Channel history](https://www.easytradeweb.com/en/keltner-channel-explained/). That version used a **10-day simple moving average of typical price**, where typical price equals **(high + low + close) / 3**. Its channel width came from the **10-day simple moving average of the daily high-low range**.
That construction measured **average absolute price movement**, not statistical dispersion. A wide day widened the channel because its high to low distance was large. The formula asked a simple question: how much ground does a typical bar cover?
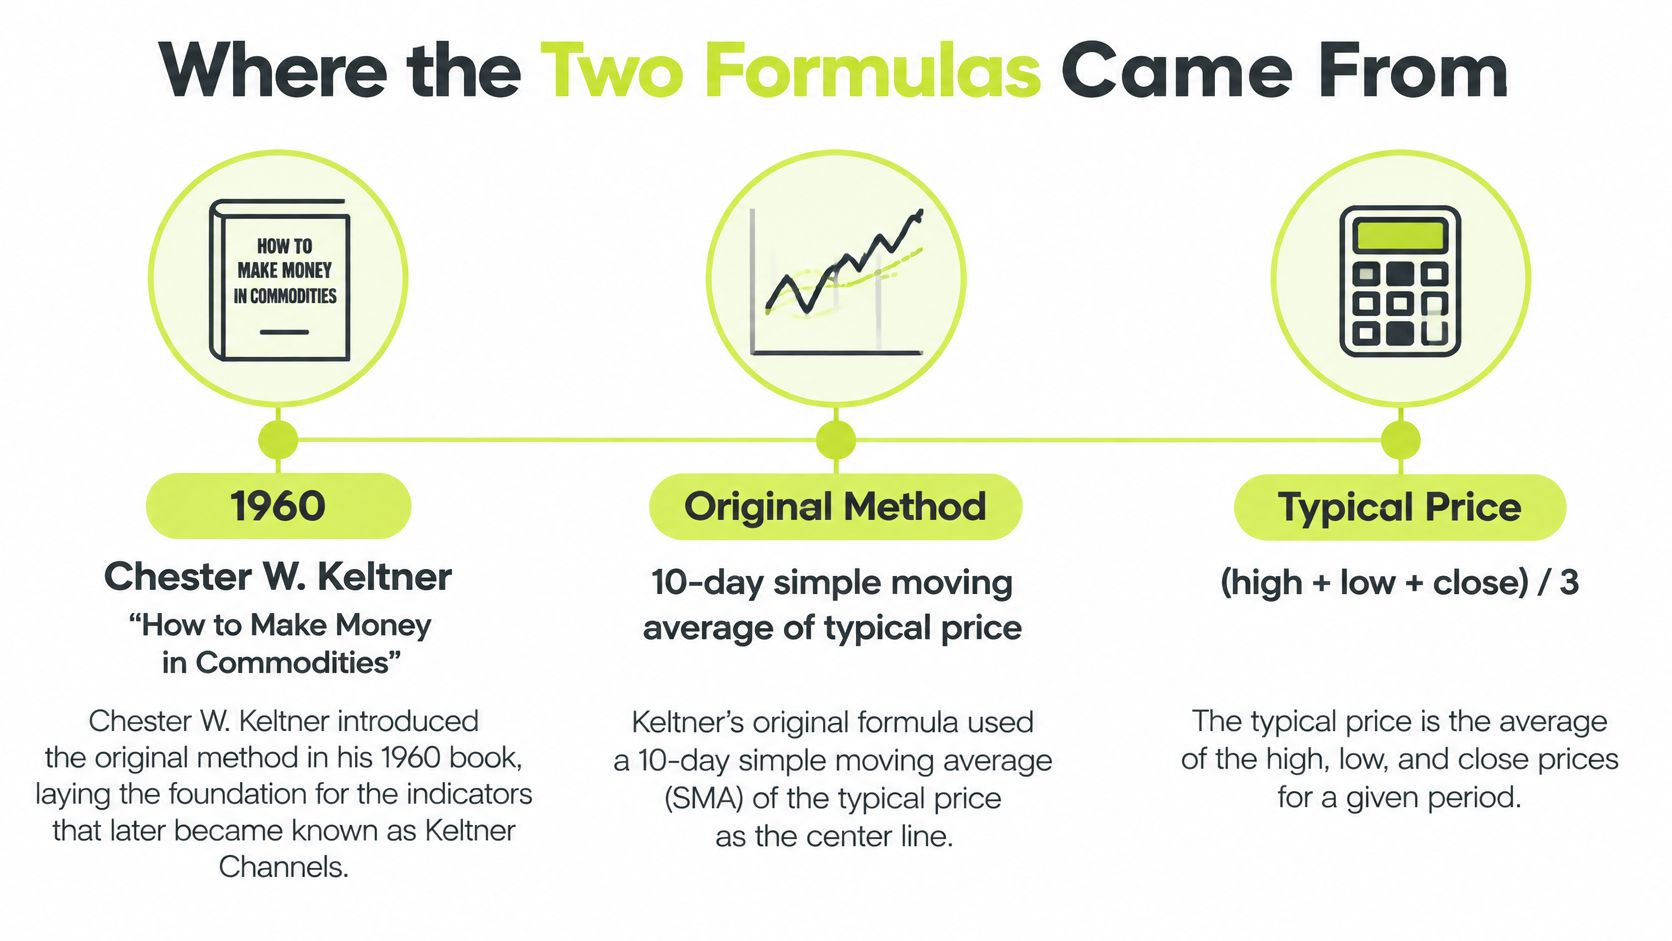
Later Keltner implementations changed the inputs while keeping the envelope idea. The center shifted toward an **exponential moving average**, and width shifted toward **Average True Range**. ATR incorporates gaps through true range, generally defined as the greatest of **high minus low**, the absolute **high minus the previous close**, and the absolute **low minus the previous close**. Many platforms now label this EMA plus ATR build as Keltner Channels, so the same name can refer to a different volatility measure than the original range average.
### A Separate Statistical Tradition
Bollinger Bands grew out of options and volatility work rather than commodity range averaging. The construction starts from dispersion around a moving average and places the edges a fixed number of standard deviations away. Its design question is how far closes scatter from their center, not how tall the average bar is.
That lineage matters for testing. Keltner width is a range gauge that can expand when a gap enters true range; Bollinger width is a close-dispersion gauge that expands when closes separate from their mean. A squeeze in either is therefore a statement that one volatility estimate is unusually compressed. It deserves a volatility-only benchmark before it is treated as directional evidence.
> **Working rule:** When someone says Keltner, ask which formula they mean before you discuss settings or signals.
The two Keltner builds can print different bands on the same chart. One centers on typical price and averages high-low ranges. The other centers on an EMA and smooths true range, so a gap beyond the prior close enters the width calculation directly.
Open your indicator settings and identify the center source, width source, period, and multiplier. The label alone does not prove which Keltner formula is running. That check takes seconds and prevents you from backtesting one formula while following instructions written for another.
## One Price Path, Two Band Readings
Say price spends a stretch of bars in a quiet range, with each close within **1.0 price unit** of its 20-period average. These are illustrative numbers, not a forecast. Both envelopes are narrow, the centers drift slowly, and price touches neither edge. At that point the indicators mostly agree because neither closes nor ranges are doing anything unusual.
Then one bar gaps up **3 units** from the prior close. That's where the readings separate.
### The Gap Bar
1. **Record the quiet range:** Note the upper and lower values for both bands before the gap.
2. **Record the gap bar:** Write down its open, high, low, close, and both upper band values at the close.
3. **Follow the next bars:** Count how long each envelope stays wide after the gap enters its calculation window.
For the Keltner calculation, the gap bar's **true range** includes the distance from the prior close to the new bar's extremes. That large range enters ATR, then smoothing spreads its effect across subsequent bars. The bands widen because the traded range, properly including the gap, became larger.
For Bollinger Bands, the important input is the gap bar's **close relative to the average of closes**. A distant close contributes a large squared deviation, so standard deviation rises and the envelope widens by an amount tied to that dispersion. If price gaps up but closes back toward the average, the two responses can differ noticeably. ATR still records the excursion, while the close-based measure gives that bar less influence.
> On a gap bar, compare band values at the close, not the lines you remember seeing while the bar was forming.
It's entirely possible for price to breach the **upper Keltner band** while remaining inside the newly expanded **upper Bollinger Band**. The reverse can also happen when a distant close inflates dispersion before range has expanded much. Neither reading is an error. Each is faithfully applying a different definition of unusual.
### When Price Rides an Edge
Now extend the sample into a trend run. Price advances in a sequence of higher closes and rides near the upper Bollinger Band. Because each new close changes both the simple average and the dispersion around it, that upper band can stay close to price for bar after bar.
The Keltner center tracks a smoother **EMA**, and its width follows smoothed range. If each trend bar has an ordinary high-low range and no gaps, ATR may change slowly even as closes march upward. Price can therefore sit at a different proportional distance from the Keltner edge than from the Bollinger edge.
- **Gap bar values:** Compare the close against both upper bands using final, closed-bar values.
- **Decay speed:** Count the bars until each envelope narrows after the large bar leaves or loses influence.
- **Confirmation rule:** Decide whether your signal fires intrabar or only after the bar closes outside a band.
That last choice matters more than many parameter tweaks. An intrabar poke through a band can disappear by the close because the band itself is still updating. If your backtest assumes a closed-bar signal but your alert fires during the bar, you aren't running the strategy you tested.
## Volatility Sensitivity and Gaps by Market
The market's trading hours determine how often price can jump between bars. That simple structural fact should influence your choice in **Keltner Channels vs Bollinger Bands** at least as much as any preference for trend following or mean reversion.
The visual below contrasts how the two envelopes react when the trading day is continuous and when it contains breaks.
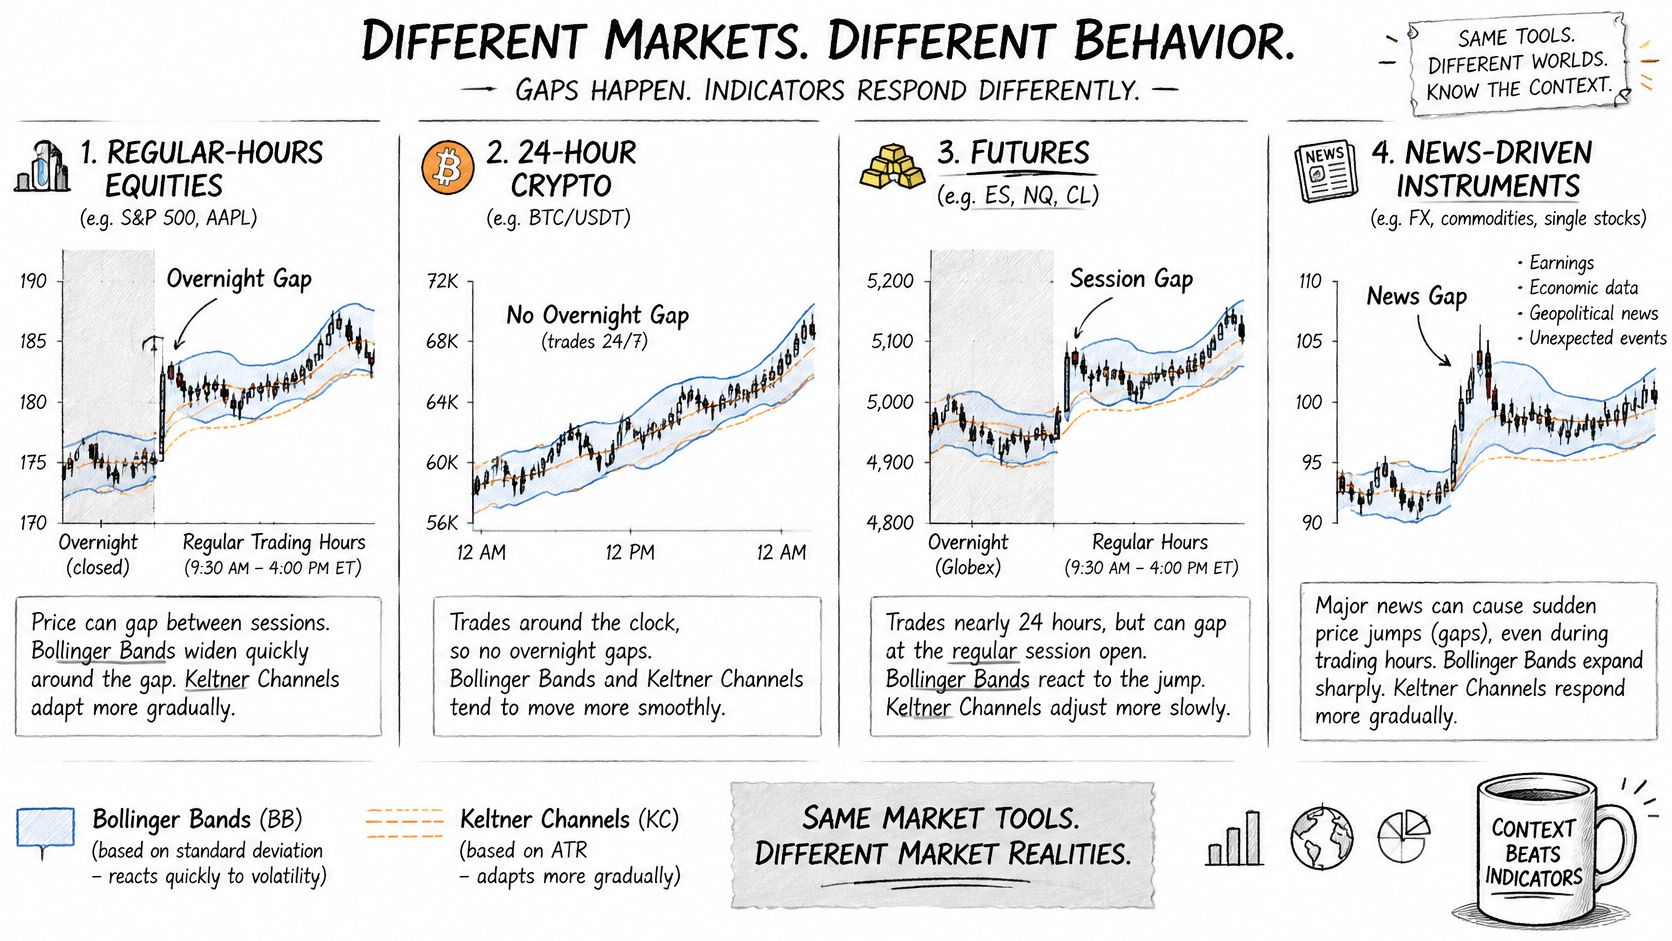
**Regular-hours equities** close overnight and can reopen far from the prior close after earnings or news. **24-hour crypto** trades continuously, so most large moves appear within consecutive bars rather than as session gaps, although exchange outages and thin periods can still create jumps. **Futures** sit between those cases because many contracts trade nearly around the clock but have daily breaks, rolls, and scheduled reports. Instruments with frequent **news gaps** present the hardest case, since a large true range can arrive without a correspondingly orderly sequence of closes.
A [Quantzee comparison of Keltner Channels and Bollinger Bands](https://quantzee.com/keltner-channels-vs-bollinger-bands/) reported that the two methods **diverged most when overnight gaps were wide** and that **Keltner breakouts tended to trigger earlier during regime changes**. Read that as a market-structure hypothesis to test, not a universal ranking. Earlier isn't automatically better if the earlier signal also produces more false entries after costs.
### Four Definitions Your Script Must Set
1. **Session boundaries:** Define which bars belong to the trading session, because including premarket or overnight bars changes both the average and the volatility window.
2. **Gap handling:** State whether true range uses the prior session close and whether your chart contains the bars needed to calculate it correctly.
3. **Bar confirmation:** Specify a closed-bar breakout or an intrabar breakout, because switching this rule can move a signal by one bar or remove it entirely.
4. **Alert timing:** Set when the alert can fire, since an early session signal is useless if it arrives after the move or arrives twice.
Each definition creates an observable difference. Change the session and a first-bar breakout may appear on the range-based envelope but not on the close-based one. Change bar confirmation and the same nominal setup can shift from the gap bar to the following bar. Change alert timing and a strategy can receive duplicate, delayed, or out-of-sequence execution even though its chart logic hasn't changed.
The following walkthrough is useful for checking how band values update as a bar forms and closes.
Automation doesn't remove those choices. Users must watch their automations because alerts can arrive **late, twice, or not at all**, markets move, and brokers reject orders. If an alert arrives but no order is placed, our signal log names the reason, whether it's **paused, duplicate, test mode, plan needed, or Robinhood not connected**.
The open question is direct. **Should channel width and breakout rules change by market microstructure?** Answer it by running identical nominal settings across two market types, then list every bar where signals differ and classify the cause as gap, session, confirmation, or alert timing. If most differences cluster around session opens, your problem isn't the multiplier. It's the definition of a bar.
## Whether Squeezes and Breakouts Add Signal
The common claim is tidy. When **Bollinger Bands contract inside Keltner Channels**, volatility has compressed so far that an expansion should follow. Traders call that condition a **squeeze**, then wait for price to break out.
The claim contains a hidden benchmark problem. Volatility clusters, meaning calm periods often follow calm periods and turbulent periods often follow turbulent ones. A squeeze indicator may appear to predict expansion because it has identified an unusually calm starting point, even if it adds nothing beyond that basic fact.
### What a Large Test Actually Found
[QuanterLab's historical squeeze study](https://quanterlab.com/research/the-calm-before-more-calm-the-ttm-squeeze-the-bollinger-squeeze-and-volatility) examined **S&P 500 stocks from 2006 to 2025** and found that **calm days were generally followed by calmer periods** and **volatile days by more volatile periods**. The squeeze itself added **little predictive information**, and much of its apparent signal was explained by the **prior direction of price**. That result challenges the usual story at exactly the right point, the squeeze's incremental value after baseline volatility and direction are considered.
The same study reported that an **upward squeeze signal was followed by a calmer week**, while a **downward signal was followed by greater volatility**. Volatility expansion therefore wasn't directionally neutral in that test. Pooling upward and downward cases into one average can hide the very asymmetry that determines whether a strategy works.
> A squeeze earns its place only if it beats a benchmark that already knows recent volatility and direction.
### The Four Cases a Fair Test Needs
- **Bollinger breakout alone:** Enter on the defined close outside the Bollinger envelope, with no squeeze precondition.
- **Keltner breakout alone:** Apply the equivalent closed-bar rule to the Keltner envelope.
- **Squeeze plus directional confirmation:** Require compression first, then a breakout in the confirmed direction.
- **Volatility-only benchmark:** Use recent volatility and prior direction without requiring one envelope to sit inside the other.
Hold exits, position sizing, transaction costs, and eligible bars constant across those cases. Split results by market regime and breakout direction. Prevent **look-ahead bias** by ensuring the squeeze state uses only information available when the order could be placed.
This is also where a squeeze differs from a general trend system. If you're comparing it with a rules-based [trend follower strategy](https://pineflows.com/blog/trend-follower-strategy), don't credit the squeeze for profits that come only from the trend filter. Remove the squeeze condition while leaving the trend filter intact, then measure what disappears.
Treat the squeeze as a **conditional filter**, not an entry trigger by default. It may still help you avoid trading during dead conditions or size positions more sensibly. The evidence threshold is stricter for entries. **If squeeze plus confirmation doesn't beat the volatility-only benchmark after costs, remove it.** Extra complexity that doesn't add incremental signal just creates more settings to overfit.
## Published Test Results and What They Show
Published comparisons don't crown a permanent winner. They show that the answer changes with market, strategy type, metric, and configuration. That's useful evidence, but only if you read each number with its denominator and trading rule attached.
### Published Head-to-Head Results
| Source and setting | Metric | Bollinger | Keltner | Other |
|---|---|---|---|---|
| StatOasis 2025, long mean reversion in five US index markets | Median return-to-drawdown | **3.52** | **3.04** | Casey Bands not stated for this metric |
| StatOasis 2025, E-mini S&P 500 and four index ETFs | Share of profitable long variants | Not stated separately | Not stated separately | Gap of **2.8 percentage points** between the two configurations |
| TakeProfit 2026, EURUSD H4 | Win rate | **58%** | **62%** | Combined strategy **68%** |
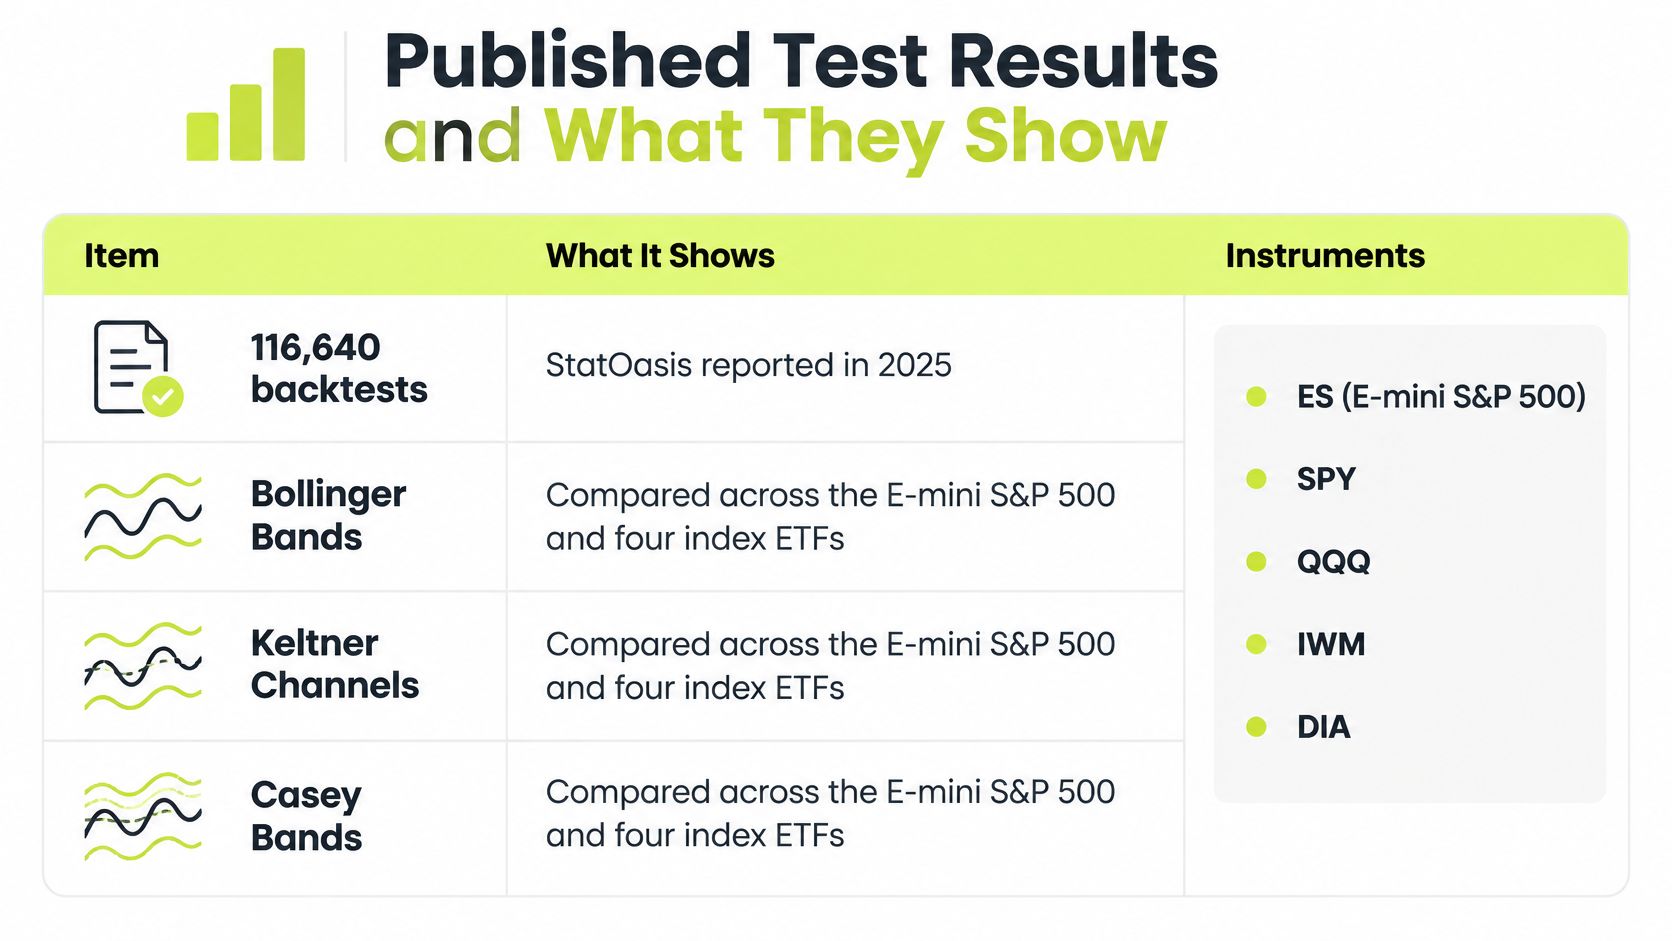
[StatOasis's 2025 backtest research](https://statoasis.com/overfit/research) reported **116,640 backtests** comparing Bollinger Bands, Keltner Channels, and Casey Bands across the **E-mini S&P 500 and four index ETFs**, with the share of profitable long variants differing by **2.8 percentage points** between Bollinger and Keltner configurations. A gap of that size across many variants doesn't establish a large structural advantage. It tells you configuration search found somewhat different proportions of profitable variants under that test design.
For long mean-reversion variants, StatOasis's Casey Bands strategy research) found median **return-to-drawdown of 3.52 for Bollinger Bands versus 3.04 for Keltner Channels** across five U.S. index markets. That's more informative than win rate because it relates return to the drawdown endured. It still applies to **long mean-reversion variants in five U.S. index markets**, not to every breakout system or asset class.
[TakeProfit's 2026 EURUSD H4 comparison](https://takeprofitapp.com/en/learn/keltner-channels-trading) reported a **62% win rate** for the Keltner-based strategy, **58%** for the Bollinger-based strategy, and **68%** for the combined strategy. Those figures can't rank the approaches by profitability because win rate ignores the size of wins and losses. A system can win more often and still make less if its average loss is larger.
### How to Read the Numbers
- **Pair win rate with payoff:** Report average win, average loss, expectancy, and total return beside every win rate.
- **Pair return with drawdown:** Compare the path taken to earn the return, not just the endpoint.
- **Count the trades:** A small trade count makes a few outcomes capable of reversing the ranking.
- **Reserve untouched data:** Rerun the selected setting on data that played no role in choosing it.
Searching many settings inflates the best-looking result because some configurations fit historical noise by chance. That's why the process in [how to backtest a trading strategy](https://pineflows.com/blog/how-to-backtest-trading-strategy) matters as much as the indicator formula. Lock the hypothesis and costs first, test a small predeclared set of variants, and validate the survivor outside the tuning sample.
The published record supports a narrow conclusion. Bollinger Bands performed better on the cited **return-to-drawdown** measure for specified long mean-reversion variants, while the cited EURUSD test gave Keltner and the combination higher **win rates**. Those aren't contradictory findings. They're different strategies, markets, timeframes, and metrics, and none of them is a forecast for your next trade.
## Pick the Band That Matches Your Market and Test It
There's **no universal winner** in **Keltner Channels vs Bollinger Bands**. For mean reversion on index markets, the published return-to-drawdown figures favor Bollinger Bands, though those results come from specific long variants and setups. For instruments with wide overnight or news gaps, ATR gives Keltner Channels a structural advantage in how the gap enters width, which is a reason to test it first rather than a proven outcome. For a squeeze used as an entry trigger, neither band is supported by default.
### Which Band to Test First by Market
| Market or situation | Lean toward | Test before going live |
|---|---|---|
| Regular-hours equities with few overnight gaps | Test both, the methods diverge least here | Breakout timing and win rate by session |
| Instruments with wide overnight or news gaps | Keltner Channels, since ATR captures gaps | Gap handling and duplicate or delayed alert behaviour |
| 24-hour crypto or forex | Test both, no default winner | Session boundary definition |
| Mean-reversion focus on index markets | Bollinger Bands, per the published return-to-drawdown figures | Return-to-drawdown after costs |
| Squeeze used as an entry trigger | Neither by default | Whether it beats a volatility-only benchmark |
### A Test Sequence That Separates Formula From Plumbing
1. **Choose by market structure:** Pick the band whose volatility definition matches how your bars form.
2. **Define sessions and gaps:** Put session boundaries, prior-close handling, and closed-bar confirmation directly in the script.
3. **Add the benchmark:** Compare your rule with a volatility-only version before adding filters.
4. **Run in test mode:** Review the alert log for timing, missing signals, and duplicates before switching to live trading.
5. **Go live only after reconciliation:** The logged alerts, expected orders, and backtest trades should match bar by bar.
We start Pineflows in **test mode**, where alerts are accepted and logged but never sent to the broker until the user switches to live mode. That delay is deliberate. Before live trading, use the workflow for [how to paper trade in TradingView](https://pineflows.com/blog/how-to-paper-trade-in-tradingview) and confirm that every test alert corresponds to the closed-bar rule you intended.
> Don't promote a strategy because its equity curve looks smooth if its alert log can't explain every signal.
Disagreement between the bands is information, not a nuisance. Log the bars where one triggers and the other doesn't, then classify each case by gap size, session position, trend direction, and whether the close or the range drove the width change. That classification will usually tell you which volatility definition belongs in your strategy faster than another broad parameter sweep.
This discussion isn't investment advice. Trading involves **risk of loss**, and a backtest is not a forecast. Your decision standard should stay plain. Pick the formula that matches the market, prove it beats the simpler benchmark after costs, and verify the automation before risking capital.
---
Turn your tested Bollinger or Keltner Pine Script rules into logged TradingView alerts first, then route verified signals to Robinhood only when the timing and duplicate checks match your backtest. Visit [Pineflows](https://pineflows.com) to start in test mode, review every alert before going live, and keep a clear audit trail for each automated order.