# Good Trading Strategy: What Separates Edge from Luck
> Learn what makes a good trading strategy: edge, expectancy, drawdown control, backtesting, and why real execution decides whether it survives live markets.
Source: https://pineflows.com/blog/good-trading-strategy
Published: 2026-10-23
Updated: 2026-10-23
Tags: good trading strategy, backtesting, risk management, trading automation, TradingView strategies
Your TradingView backtest looks promising. The equity curve climbs, the entries look sensible, and you're wondering whether to connect the strategy to your brokerage account. But the question isn't whether the chart looks convincing. It's whether you can trade those signals, at executable prices, without taking risks the backtest never measured.
## Table of Contents
- [What a Good Trading Strategy Really Means](#what-a-good-trading-strategy-really-means)
- [Define what would make the strategy unacceptable](#define-what-would-make-the-strategy-unacceptable)
- [Judge the process, not the prettiest outcome](#judge-the-process-not-the-prettiest-outcome)
- [The Four Pillars Every Good Trading Strategy Needs](#the-four-pillars-every-good-trading-strategy-needs)
- [Edge needs an explanation](#edge-needs-an-explanation)
- [Risk management must fit the payoff distribution](#risk-management-must-fit-the-payoff-distribution)
- [Measuring Whether Your Strategy Actually Works](#measuring-whether-your-strategy-actually-works)
- [Read the metrics together](#read-the-metrics-together)
- [Make the report auditable](#make-the-report-auditable)
- [How to Backtest and Walk-Forward Test a Strategy](#how-to-backtest-and-walk-forward-test-a-strategy)
- [Separate development from evaluation](#separate-development-from-evaluation)
- [Challenge the assumptions that improve results](#challenge-the-assumptions-that-improve-results)
- [Why Real Execution Can Erase a Backtested Edge](#why-real-execution-can-erase-a-backtested-edge)
- [Measure the path from alert to fill](#measure-the-path-from-alert-to-fill)
- [Choose a reference before reviewing outcomes](#choose-a-reference-before-reviewing-outcomes)
- [Common Types of Trading Strategies Compared](#common-types-of-trading-strategies-compared)
- [Major Trading Strategy Types at a Glance](#major-trading-strategy-types-at-a-glance)
- [Match the approach to its failure mode](#match-the-approach-to-its-failure-mode)
- [Taking a Validated Strategy Live with Automation](#taking-a-validated-strategy-live-with-automation)
- [Verify safeguards before authorizing orders](#verify-safeguards-before-authorizing-orders)
- [Test the integration separately from the strategy](#test-the-integration-separately-from-the-strategy)
## What a Good Trading Strategy Really Means
A **good trading strategy** has a measurable reason to earn returns, a defined risk budget, and trading rules you can implement under live conditions. Historical profitability is evidence worth investigating, not permission to deploy capital.
Consider a hypothetical Pine Script strategy that enters after a breakout and exits when momentum weakens. Its historical trades look clean because the tester assigns fills according to its simulation settings. Before trusting the result, you need to establish whether those settings match when the signal becomes available and when an order could execute.
That distinction changes the evaluation. You're not buying an equity curve. You're accepting a repeatable decision process, including its losing periods and operational dependencies.
### Define what would make the strategy unacceptable
Write a strategy specification before judging the performance report. It should explain:
- **The hypothesis:** Why should this particular exposure or trading behavior produce an advantage?
- **The trading rules:** What information permits an entry, changes position size, or requires an exit?
- **The operating boundaries:** Which instruments, sessions, and account conditions are allowed?
- **The rejection criteria:** What evidence would make you stop testing or suspend deployment?
A specification should resolve uncomfortable cases, not just describe attractive setups. If an exit signal arrives while an entry remains unfilled, the intended position must still be unambiguous. If the account already holds the instrument, the strategy needs a rule for whether that position belongs to the system.
> **Practical rule:** If you can't explain what the strategy should do when an order fails, its trading rules aren't finished.
### Judge the process, not the prettiest outcome
A useful standard combines **economic plausibility, survivable losses, honest validation, and executable orders**. None substitutes for another. A sensible hypothesis can be implemented badly, while a flawless automation pipeline can execute an unprofitable hypothesis exactly as written.
The evaluation should therefore extend beyond entries and exits. You need evidence about return quality, drawdowns, sensitivity to assumptions, and the difference between simulated and observed trading. Treat every performance claim as provisional until the relevant costs and implementation constraints are included.
## The Four Pillars Every Good Trading Strategy Needs
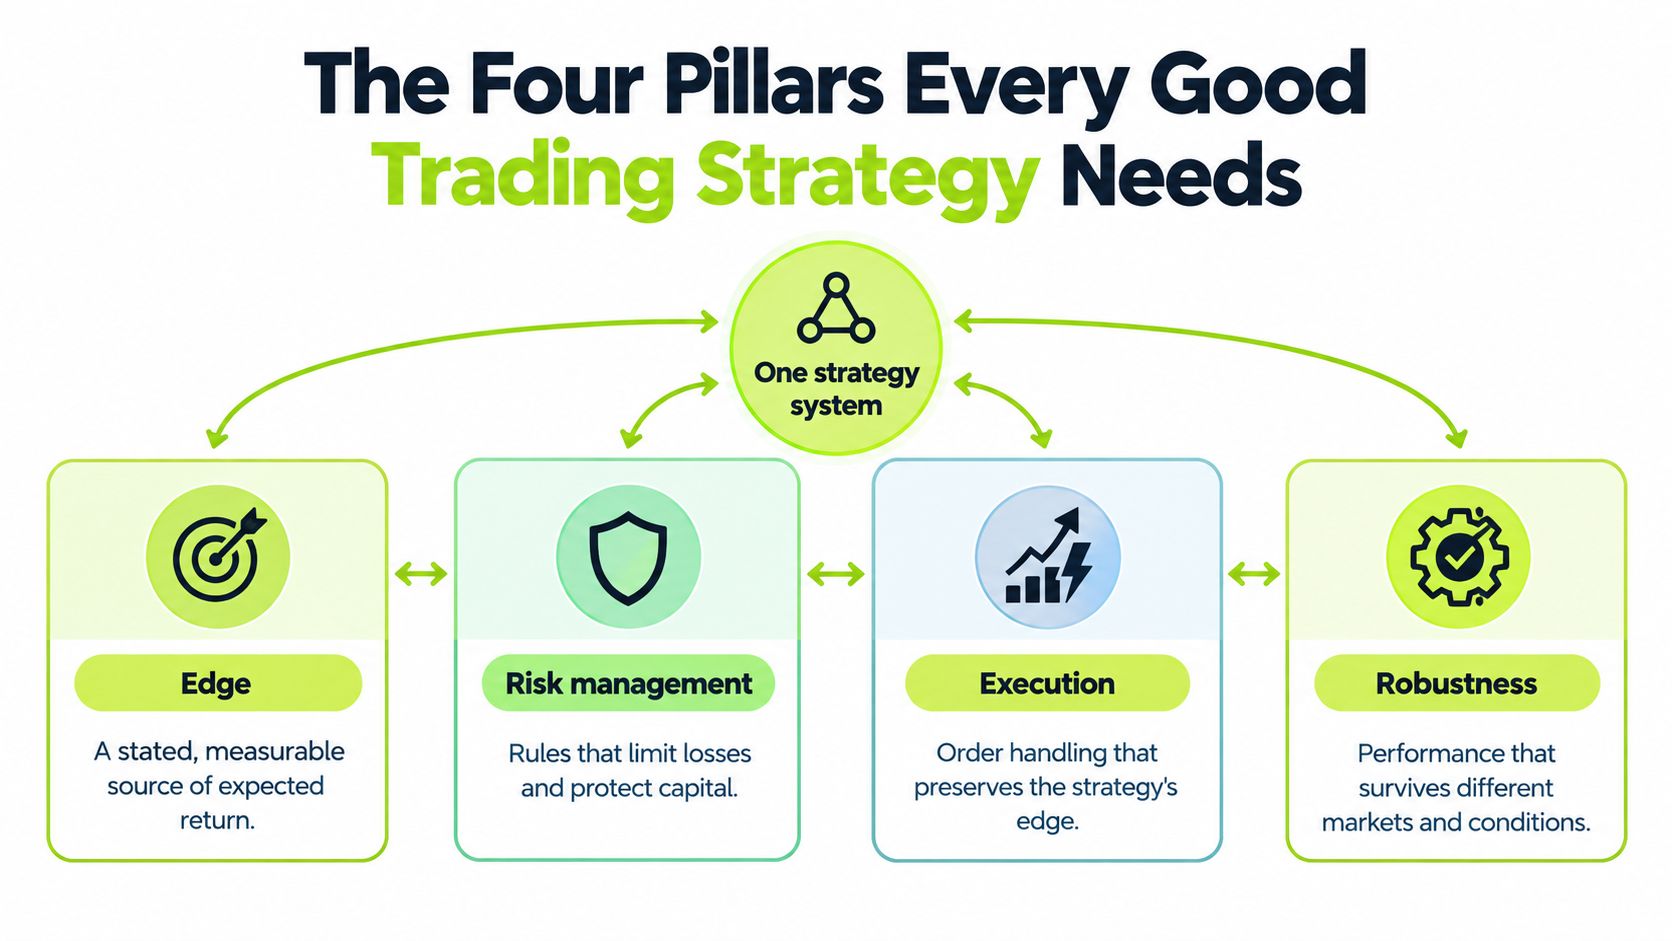
Think of the strategy as an interconnected system rather than an indicator with a stop attached. **Edge and risk management** establish what you're trying to earn and what you can afford to lose. **Execution and reliability** determine whether the tested design remains useful outside the original simulation.
### Edge needs an explanation
An entry condition isn't an explanation of expected return. A moving-average crossover describes a trigger. The underlying hypothesis might be that sustained directional moves can compensate for unsuccessful entries, but that proposition still needs testing.
Factor research provides a useful contrast to unsupported pattern hunting. The Fama–French framework identifies **market, size, value, profitability, and investment** as measurable dimensions associated with historical stock returns, as summarized in the [Fama–French factor research overview](https://www.ifa.com/videos/ifa-charts-fama-french-five-factor-model). That doesn't validate an intraday strategy or guarantee future premiums. It illustrates what a clearly defined source of return looks like.
Your own hypothesis should be similarly testable. Specify the exposure, the proposed mechanism, and the conditions under which you expect it to disappoint.
### Risk management must fit the payoff distribution
Position sizing translates the hypothesis into account-level consequences. Evaluate exposure across simultaneous positions, not just the apparent risk of an isolated trade. Different symbols don't necessarily represent different risks.
**Expectancy** connects the frequency of winning trades with the size of wins and losses:
**Net expectancy = win probability × average win − loss probability × average loss − average trading costs**
Keep the inputs consistent. If average wins and losses already include costs, don't subtract those costs again. A high win rate is insufficient when occasional losses outweigh the accumulated gains.
Drawdown control then addresses whether you can continue following the system through adverse sequences. Define acceptable exposure, escalation rules, and the circumstances that require a review before those circumstances occur.
- **Execution:** The order-handling process must preserve the intended position and make exceptions visible.
- **Reliability:** The investment case shouldn't depend on a narrowly selected parameter or an unusually favorable historical interval.
These pillars constrain each other. Increasing position size doesn't repair weak expectancy. Adding filters doesn't establish reliability. Improving order delivery doesn't establish an edge. The system is only deployable when its weakest component is acceptable.
## Measuring Whether Your Strategy Actually Works
Trade count measures activity, not competence. In the household-trading research published in **2000**, the most active households earned **11.4% annually**, versus **17.9% for the market**, a **6.5 percentage-point shortfall**, according to the [report on Odean's household-investor findings](https://libn.com/2000/05/05/overactive-trading-is-hazardous-to-your-wealth/). It's a useful warning against treating frequent execution as evidence of skill.
Your reporting should make that mistake difficult. Put **gross return, net return, cost drag, and drawdown** beside each other, using the same evaluation period and capital assumptions.
### Read the metrics together
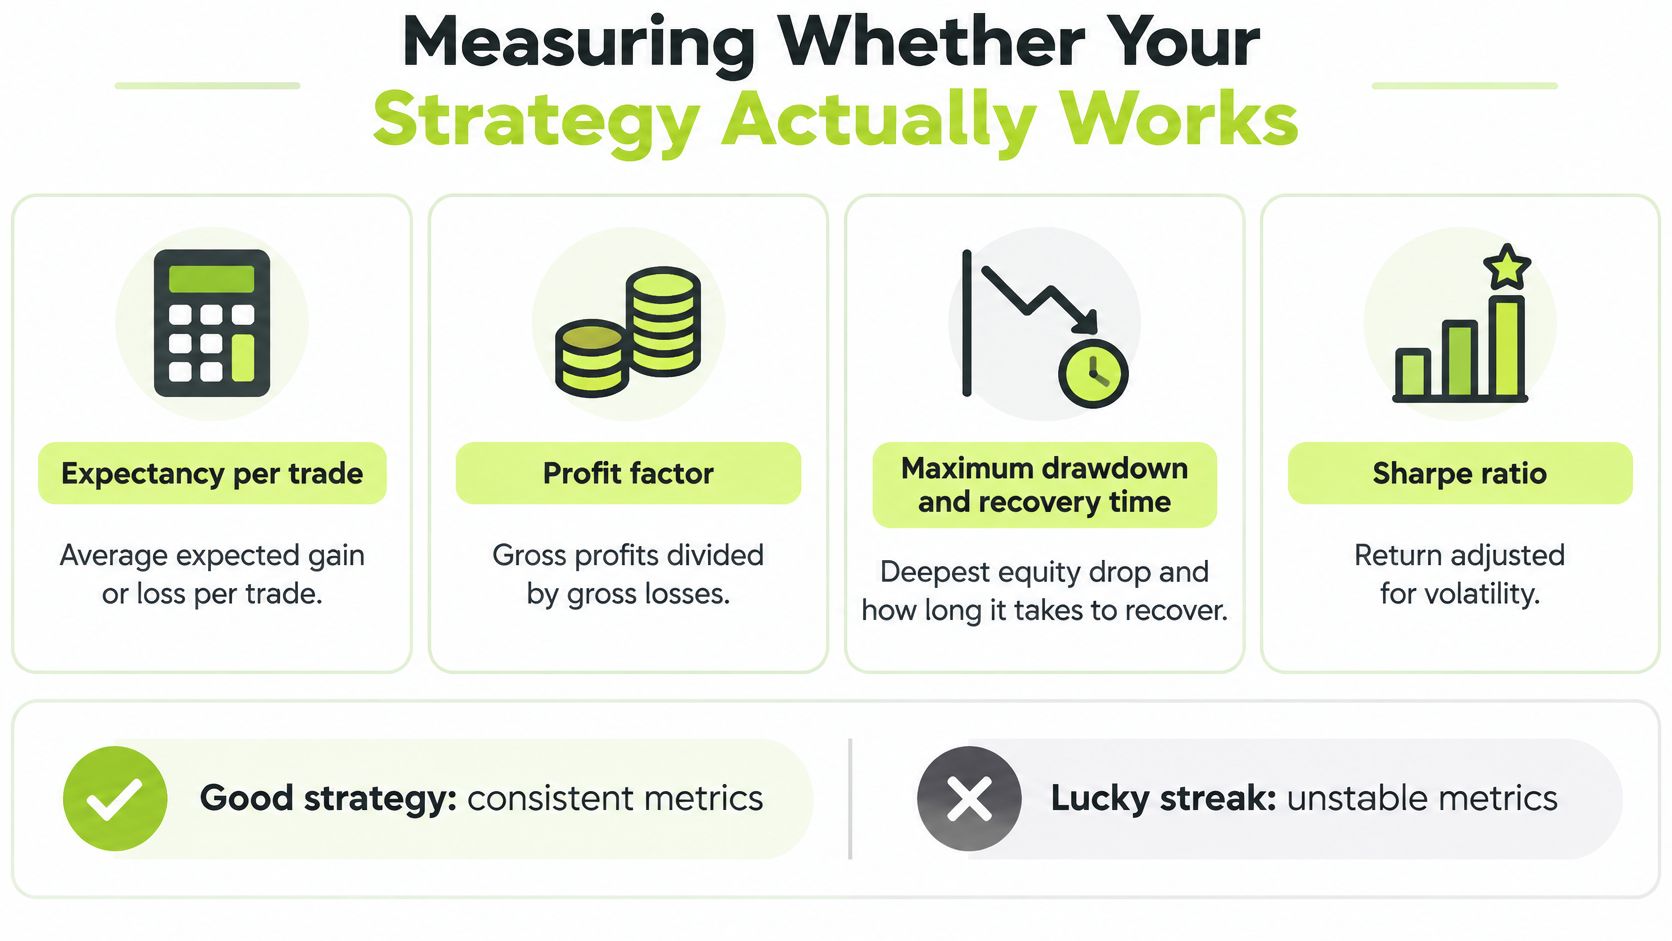
**Expectancy per trade** tells you the average outcome under the tested assumptions. Inspect its distribution too. A strategy whose profitability depends on unusually large winners needs a different review from one with broadly distributed gains.
**Profit factor** compares aggregate winning-trade profits with aggregate losing-trade losses. Calculate it from cost-adjusted trade outcomes, and check whether removing exceptional trades changes the conclusion.
**Maximum drawdown and recovery time** describe the depth and duration of the worst observed setback. Historical maximum drawdown isn't a ceiling on future losses. Use it as a stress reference, not a promise.
**Sharpe and Sortino ratios** provide complementary views of return relative to variability or downside variability. Keep the sampling frequency and calculation method consistent when comparing strategies.
### Make the report auditable
A compact reporting standard keeps attractive summary figures attached to their assumptions.
| Report field | What to inspect |
|---|---|
| Gross and net return | Whether estimated costs materially change the investment case |
| Cost drag | Which costs were included and which remain unmodeled |
| Net expectancy and profit factor | Whether gains depend on exceptional trades |
| Drawdown and recovery | Whether losses fit your capital and operating constraints |
| Risk-adjusted return | Whether comparisons use consistent calculations |
| Turnover | How much trading the strategy requires to produce its return |
Don't hide turnover beneath the performance chart. It tells you how often the strategy must incur implementation costs. Record commissions, spreads, slippage, and applicable taxes consistently, and distinguish observed costs from estimates.
The final question isn't which metric looks strongest. It's whether the metrics support the same conclusion about a tradable, tolerable process.
## How to Backtest and Walk-Forward Test a Strategy
Start with a written protocol, not repeated optimization. Decide what you'll test, what you're allowed to change, and what qualifies as failure before inspecting the final evaluation results.
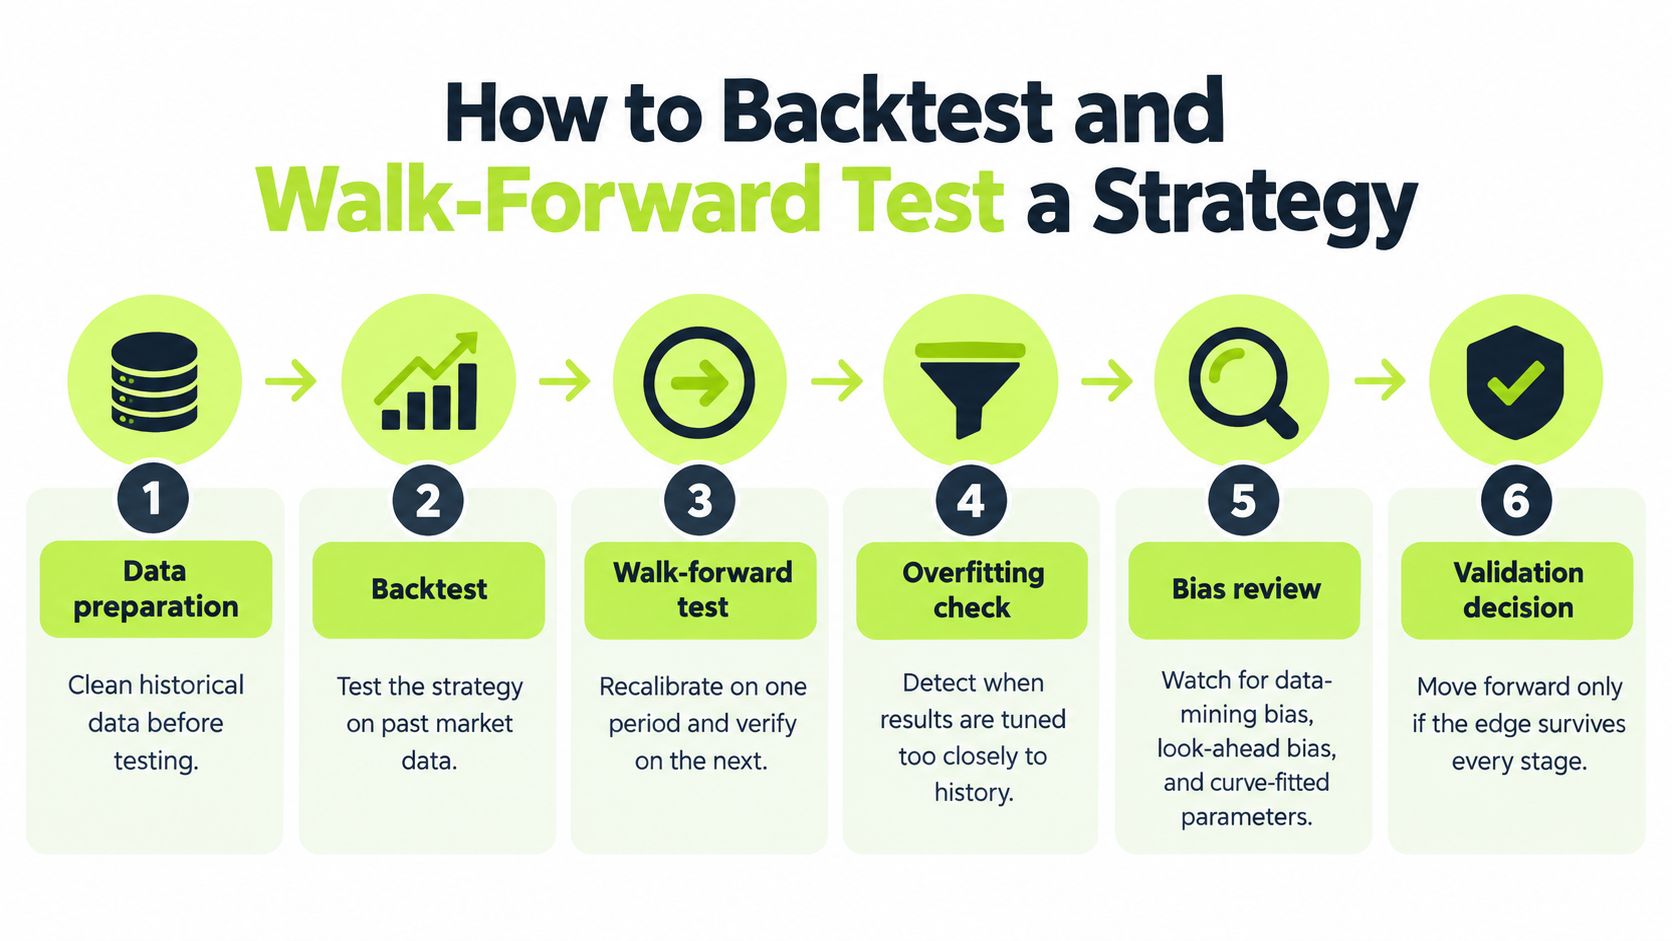
Use a staged validation process rather than treating a completed backtest as the endpoint.
### Separate development from evaluation
- **Prepare the data:** Check timestamps, missing observations, instrument adjustments, and whether each input was available at the simulated decision time.
- **Reserve unseen history:** Use development data to construct the rules and separate data to evaluate them. Once you tune against the reserved results, those results no longer represent an untouched test.
- **Walk forward:** Recalibrate using an earlier window, freeze the selected configuration, and evaluate it on the following window. Repeat chronologically without allowing later observations into earlier decisions.
- **Review sensitivity:** Examine neighboring parameter settings and different market conditions. Investigate results that collapse after modest changes.
The distinction between backtesting and walk-forward testing is procedural: you're testing how the selection process behaves, not merely whether a final parameter set fits history. A practical review of [backtested trading strategies](https://pineflows.com/blog/backtested-trading-strategies) should keep that distinction explicit.
### Challenge the assumptions that improve results
**Look-ahead bias** means using information before it would have been available. **Data-mining bias** arises when extensive searching produces an attractive candidate whose selection history is ignored. **Overfitting** means tailoring rules so closely to the development sample that the apparent advantage doesn't generalize.
Inspect the actual Pine Script logic, not just the Strategy Tester output. Establish when a condition becomes knowable, how intrabar behavior is modeled, and whether the assumed order timing matches the intended alert configuration.
The embedded video provides another format for reviewing the testing process.
Stress the model with less favorable fills, interrupted delivery, and incomplete executions. Don't assume a universal minimum trade count establishes statistical reliability. Examine uncertainty, dependence between trades, and whether the sample contains different conditions.
> A strategy that survives only its most favorable fill assumptions hasn't passed validation.
Keep a research log of rejected versions as well as accepted ones. Otherwise, the final report conceals how much searching produced the selected result.
## Why Real Execution Can Erase a Backtested Edge
A signal price and an executable price are different measurements. The first describes a decision reference. The second describes what happened when an order reached the trading venue.
A **2025 controlled study** placed approximately **85,000 identical market orders across six major U.S. brokers** and found average round-trip costs ranging from **7 to 46 basis points**, according to the [retail equity execution study](https://instituteforautomatedresearch.org/wiki/papers/jf/2025/schwarz-actual-retail-price-equity-2025/). The researchers largely attributed the differences to market centers providing systematically different execution across brokers, rather than to routing choice or payment-for-order-flow differences.
That finding doesn't tell you what your own strategy will pay. It tells you why a generic cost assumption is insufficient evidence.
### Measure the path from alert to fill
For an alert-based strategy, preserve separate timestamps for signal generation, webhook receipt, order submission, broker acknowledgment, and execution. Those records let you distinguish delayed signal delivery from delayed broker handling.
Also preserve the intended quantity, accepted quantity, filled quantity, and remaining exposure. An accepted order isn't a completed trade, and a partial fill isn't equivalent to the position assumed by the backtest.
| Execution-adjusted scorecard | Measurement |
|---|---|
| Gross simulated result | Performance before implementation costs |
| Cost-adjusted simulated result | Performance under documented fill and cost assumptions |
| Decision reference | Price and timestamp used when the signal became actionable |
| Actual execution | Fill prices, quantities, timestamps, and order status |
| Realized slippage | Difference between the chosen reference and actual fills |
| Exceptions | Stale signals, missing events, rejections, and incomplete orders |
### Choose a reference before reviewing outcomes
Slippage comparisons become misleading when the reference price changes opportunistically. Define whether you're comparing fills with the signal-time quote, submission-time quote, or another observable benchmark, then apply that convention consistently.
Avoid counting spread costs twice when the slippage measure already includes them. Include adverse and favorable fills rather than recording only execution disappointments.
> **Execution test:** Can you explain the difference between the simulated position and the broker position using recorded events?
The comparison between [manual trading and automated trading](https://pineflows.com/blog/manual-trading-vs-automated-trading) should use this evidence rather than assume automation produces better prices. Automation can standardize submission and improve traceability. Whether it preserves enough return to justify deployment remains an empirical question.
## Common Types of Trading Strategies Compared
Choose a strategy family by the hypothesis you can investigate and the trading process you can operate. Don't choose it because a particular historical chart looks smoother than the alternatives.
The descriptions below are a working classification, not evidence that every implementation has an edge. Holding periods depend on the rules rather than the strategy label.
### Major Trading Strategy Types at a Glance
| Strategy Type | Source of Edge | Typical Holding Period | Biggest Weakness |
|---|---|---|---|
| Trend following | Hypothesized persistence in directional moves | Intraday through extended holding periods | Repeated reversals in directionless conditions |
| Mean reversion | Hypothesized correction of temporary deviations | Brief trades through multi-session positions | Mistaking a lasting repricing for a temporary deviation |
| Breakout trading | Hypothesized continuation beyond a defined range | Intraday through swing positions | Failed breaks and difficult entry prices |
| Momentum | Hypothesized continuation in relative or absolute strength | Shorter-term through extended holdings | Abrupt reversals and concentrated exposures |
| Factor-based strategies | Systematic exposure to defined return dimensions | Longer-horizon holdings with scheduled rebalancing | Extended underperformance and implementation constraints |
| Scalping | Hypothesized repeatable advantage in brief price movements | Very short holding periods | Costs and execution errors overwhelming small trade gains |
### Match the approach to its failure mode
A trend follower accepts unsuccessful entries while seeking participation in sustained moves. Its evaluation should therefore examine whether the trader can tolerate repeated losses without changing the rules before a favorable period.
Mean reversion asks a different question: why should the reference level remain relevant? Buying because price has fallen isn't enough. The test must distinguish the proposed temporary dislocation from conditions that invalidate the anchor.
Breakout and momentum systems can share directional exposure while using different selection and entry rules. Compare their positions during stressful periods rather than assuming different indicators provide diversification.
- **Factor portfolios:** Review how the intended exposure survives portfolio construction, liquidity constraints, and rebalancing.
- **Scalping systems:** Require especially careful measurement of implementation costs relative to the expected trade outcome.
- **Mixed systems:** Inspect overlapping holdings and shared failure conditions before treating separate strategy names as independent risks.
Your available attention matters too. A process requiring continuous exception handling is a poor fit if you can only review the account intermittently. A longer-horizon approach may reduce some operational demands, but it still needs explicit order and exposure controls.
There's no universal winner. Prefer the approach whose hypothesis you can explain, whose weaknesses you can test, and whose losing periods you can finance without improvising.
## Taking a Validated Strategy Live with Automation
Deployment introduces responsibilities that historical testing can't discharge. In **July 2025**, FINRA warned that automated or third-party trading can implement investments inconsistent with an investor's risk tolerance and generate significant losses before the investor realizes transactions occurred, in its [investor guidance on auto-trading services](https://www.finra.org/investors/insights/auto-trading-unregistered-entities).
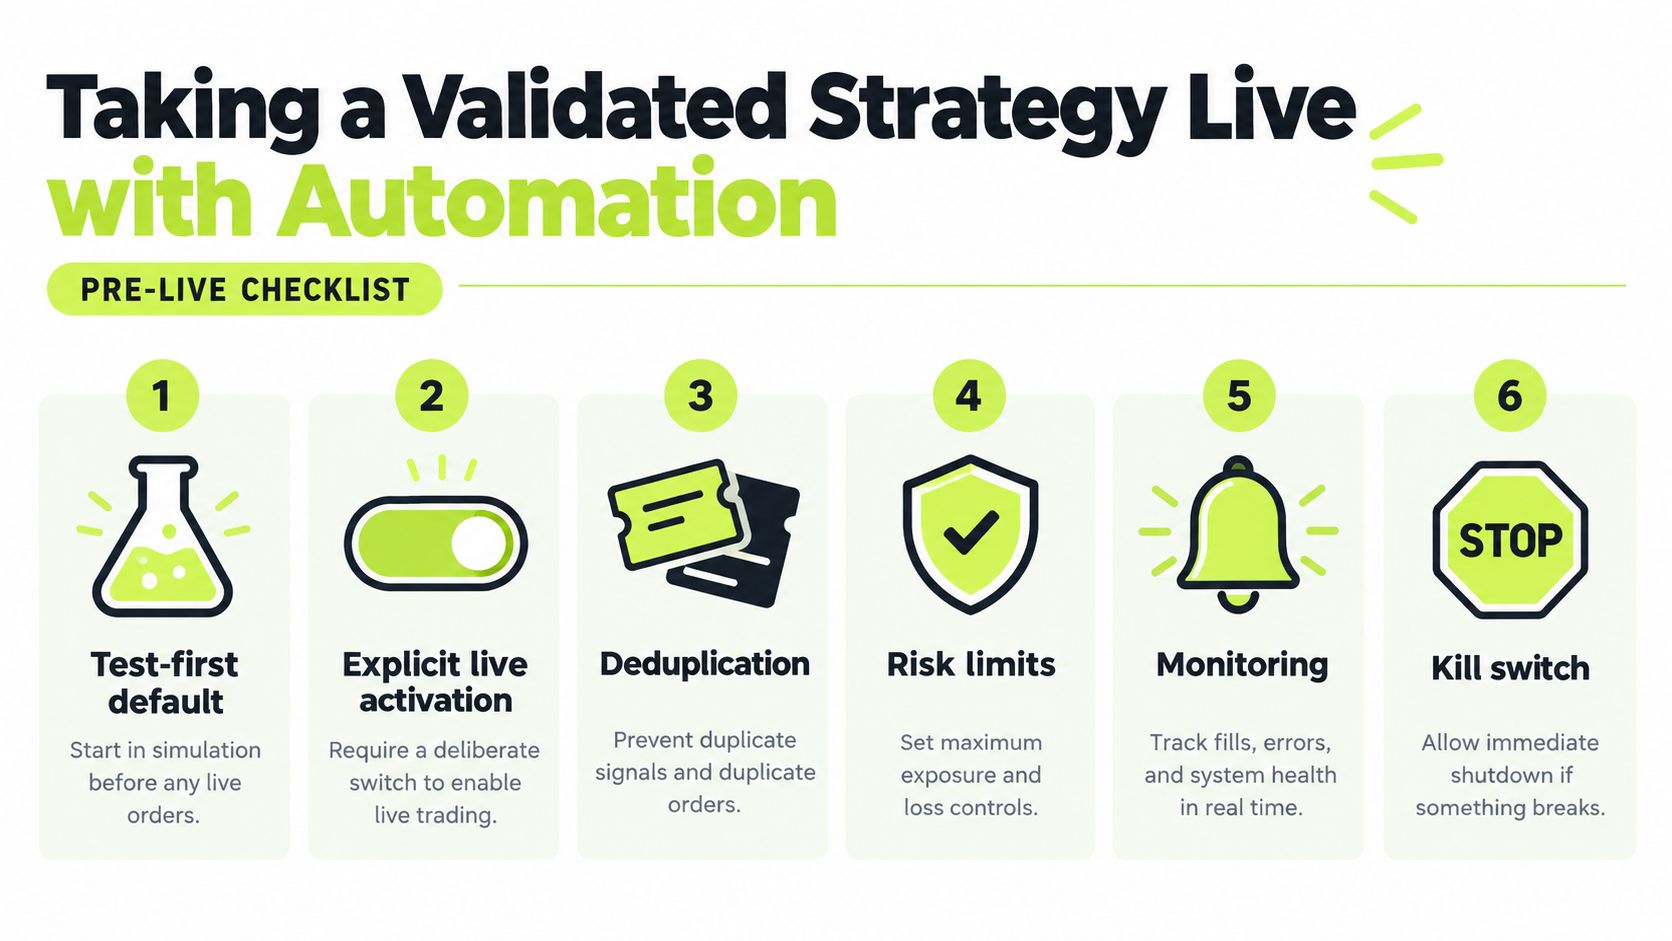
Use a pre-live checklist to establish who controls the account and how failures become visible.
### Verify safeguards before authorizing orders
- **Test-first operation:** Incoming alerts should be inspectable without transmitting broker orders.
- **Deliberate activation:** Live execution should require an explicit decision after configuration review.
- **Event deduplication:** Use persistent event identities so repeated delivery doesn't create repeated exposure.
- **Exposure limits:** Define allowed instruments, position sizes, notional limits, and treatment of existing holdings.
- **Freshness checks:** Specify when an alert is too old to act on.
- **Reconciliation:** Compare requested orders, broker acknowledgments, fills, and actual positions.
- **Recoverable interruption:** Preserve audit records and a pause process that stops new risk without disabling valid risk-reducing exits.
A pause control shouldn't merely make the interface look inactive. Establish what happens to outstanding entry orders and whether exits remain available.
### Test the integration separately from the strategy
For a TradingView-to-Robinhood workflow, distinguish signal testing from execution testing. A logging-only environment can verify payloads and intended actions, but it cannot establish live fill quality.
One implementation uses a single webhook alert, a paid TradingView plan with two-factor authentication, Google sign-in, and a Claude connector that proposes automation parameters from Pine Script. Review those proposed instruments, sizing rules, entries, and exits against your written specification rather than accepting generated configuration uncritically.
When selecting an [automated trading platform](https://pineflows.com/blog/automated-trading-platform), ask whether broker credentials remain with the broker, whether event histories are inspectable, and whether pause behavior is documented. Treat these as acceptance criteria, not substitutes for strategy validation.
Route a selected strategy through test mode and compare each logged event with the trade your rules intended. Resolve mismatches before considering live activation, then evaluate actual execution under deliberately limited exposure.
---
[Pineflows](https://pineflows.com) offers a test-first pipeline that converts TradingView strategy alerts into Robinhood market orders, with event logs and pause controls. Visit the platform to route a validated strategy in test mode and compare logged alerts with intended trades before enabling live execution.